

The “debunking”
Many critics of my electrical substation theory have argued that it can’t be the reason for the 49ers’ increased injury rate since 2013 because they have practiced at their current location since 1988. They are right about the year they started practicing there, but they are wrong about the substation. For the 49ers’ first thirteen years, the old Tasman substation, a much smaller station built in 1976, was the only substation nearby, and it was several hundred yards away, in what is now a parking lot for the stadium.¹⁸
In 2001 the site directly behind the practice facilities was still an empty parcel; state regulators that year described a 115 kV substation there as “approved (but not yet built).”⁷¹ Between then and 2003 the city built the Northern Receiving Station (NRS) on it, and sometime thereafter it was energized. By 2004 or 2005 the 230 kV busses were added and that has been its operating form ever since.¹⁴ ²⁶ ⁷¹ Not only was it much closer than Tasman station, it was qualitatively different. NRS is the front door of Santa Clara’s grid: the place where bulk power arrives from the outside grid and is stepped down for the city’s internal transmission loops.
However, in January I wrote that the substation beside the practice facility had been expanded alongside Levi’s Stadium, and I relayed an engineer’s reading of aerial imagery explaining that substation equipment south of the practice fields was installed in 2010–2011. That appears to be wrong. The city planned a new substation beside NRS to replace Tasman along with the stadium construction, but they never built it. They built the Mission substation a mile south instead.¹⁹ ²¹ ⁶³ And I can find no public record of any equipment change at NRS between its 230 kV energization around 2004 and a breaker replacement in the spring of 2018. That doesn’t mean nothing changed in that period, but if something did change we have no evidence.
Critics treat that as the end of the theory, though, and it isn’t. The question was never whether there was a new substation or not; the question is whether electromagnetic field exposure increased at the practice facilities around the time Levi’s Stadium went in. On that, my position has not changed: we need to compare EMF measurements at the practice facility today with measurements from before the Levi’s era. There are no publicly available measurements, though, so the next best thing is to establish what infrastructure was there before the stadium was built, what was there after, and what we can discern about the electrical load running through it over time. This piece carefully documents both of those factors with the publicly available documents from the City of Santa Clara, Silicon Valley Power (SVP) — Santa Clara’s city-owned utility, and the State of California. It shows two things:
The electrical load increased dramatically across SVP’s system.
New infrastructure went in behind the practice facility during the stadium build-out.
What’s more, we have a report from SVP showing what those two factors do to a magnetic field: each one raises it, individually, and together they multiply it — two, three, twenty times over on the streets adjacent to Levi’s stadium. Whatever did or didn’t happen with the substation itself, those two factors alone would have the same effect as a substation expansion.
103 milligauss
On October 8, 2024, the Santa Clara City Council took up the route for a new 115-kilovolt (kV) transmission line. It would start at the Northern Receiving Station and run 2.24 miles down Lafayette Street next door to the 49ers’ practice facilities, through neighborhoods and past several schools, to the Kifer Receiving Station.⁴⁷ The chamber filled with residents worried about increased EMF exposure from the line, and the council put the vote off a month.⁴⁷
On November 12 SVP returned with a report modeling magnetic fields along the route before and after the addition of the new line.⁵¹ They also brought in an outside expert: Dr. Gabor Mezei of Exponent a local firm that specializes in scientific consulting for companies facing liability issues (whose EMF work I wrote about in April).⁵² Mezei came to Exponent from the Electric Power Research Institute, where he ran the EMF health program: research the electric utilities fund to establish the safety of their own product.⁵² SVP had hired the industry’s own expert to testify that the industry’s product is safe. “Overall,” he told the council, “none of these expert panel reviews arrived at the conclusion that the available evidence confirms EMF, power frequency EMF, causes any sort of adverse health effects.”⁵⁰ The city’s staff report compared the line’s fields to “a vacuum cleaner.”⁵⁰
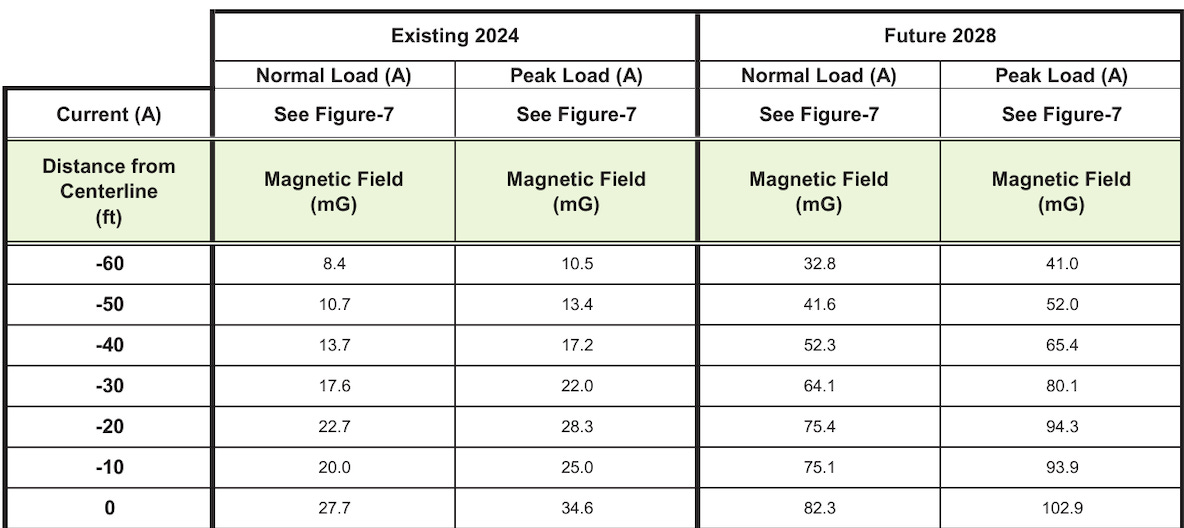
The calculations are the only field model Silicon Valley Power has made publicly available for a line leaving NRS, and they prove two things: new infrastructure means a higher magnetic field, and more current on a power line means a higher magnetic field. The first comes from the report’s “existing” and “future” columns, which show the same streets before and after the new line is added, with the existing circuits left in place. The second comes from its “normal” and “peak” columns, which show the same wire at two currents — its normal load and its anticipated peak in 2028.
The line’s first stretch runs through the residential grid immediately southeast of the station, where the existing magnetic field one meter above the ground is under 3 milligauss along most of the median — toward the upper end of what a typical home measures. With the new line carrying the load it was designed for, the same spot reads 43 milligauss directly beneath the wires and 20 milligauss sixty feet away, which is about where the front walls of the houses along the street stand. Farther south, where the new circuit rides above an existing 12 kV line, the field goes from 3 to 63. These are the utility’s own numbers, calculated to reassure the residents and give the council license to approve the project.
Legally, they are in the clear. There is no federal limit on magnetic-field exposure, and California sets none of its own, asking only for “low-cost and no-cost” mitigation.⁶² The guideline SVP’s expert works from, set by the International Commission on Non-Ionizing Radiation Protection (ICNIRP), cuts off at 2,000 milligauss.⁵⁹ The sleight of hand is that this is the wrong measurement. The 2,000-milligauss threshold exists to prevent acute effects — the level at which a magnetic field induces enough current in the body to stimulate nerves — and ICNIRP’s authors state clearly that it is not designed to address long-term, low-level exposure.⁵⁹ It is the right number for an electrician working on a power line and the wrong number for a child sleeping in their bedroom. The numbers not listed by ICNIRP are these: 3 to 4 milligauss. The studies that led the World Health Organization’s cancer agency to classify power-frequency magnetic fields as a possible carcinogen found an association with childhood leukemia at as little as 3 milligauss.⁵⁸ Calling the fields on Lafayette Street safe means asking the families there to put their children to bed under the acute standard.
The appliance comparison made by SVP’s expert hides the same two things: time and distance. A hair dryer reads a few hundred milligauss at your scalp and is nearly gone by about an arm’s length away, and you run it for five minutes.⁵⁹ A transmission line’s field reading 40 milligauss in a bedroom sixty feet away never stops. The question the comparison actually invites is whether you would allow your kids to sleep with their hair dryer running on the pillow next to their head all night.
The council approved the route 4–1.⁵⁰
Buried in the same report is a number that has relevance specifically for the practice facility. Most of the report’s nineteen segments start from a bare median or a neighborhood distribution line. Several start from an existing transmission line: a 60 kV circuit on poles with a 12 kV line underneath — an ordinary Silicon Valley Power transmission line, carrying an ordinary load.⁵¹ Take that line by itself. SVP’s model puts it at 25 to 35 milligauss beneath the wires and 6 to 14 sixty feet away. Now add the new 115 kV circuit, and the field under the poles goes up to 103 milligauss at peak load, and the field sixty feet out goes up to 41. 103 milligauss is the largest number in the report, and it comes from putting a new transmission line next to an old one.
A line of exactly that type was installed behind the 49ers’ practice facilities during the Levi’s Stadium build-out. It starts at the existing substation, and it ends at Mission substation, which was powered on in 2014.⁶⁴ ²⁴ ⁶³ Behind the practice facility, the existing source isn’t a 60 kV circuit; it is the receiving station itself, with its 230, 115, and 60 kV buses a stone’s throw away. The configuration SVP modeled on Lafayette Street at 103 mG is the configuration behind the practice facilities.
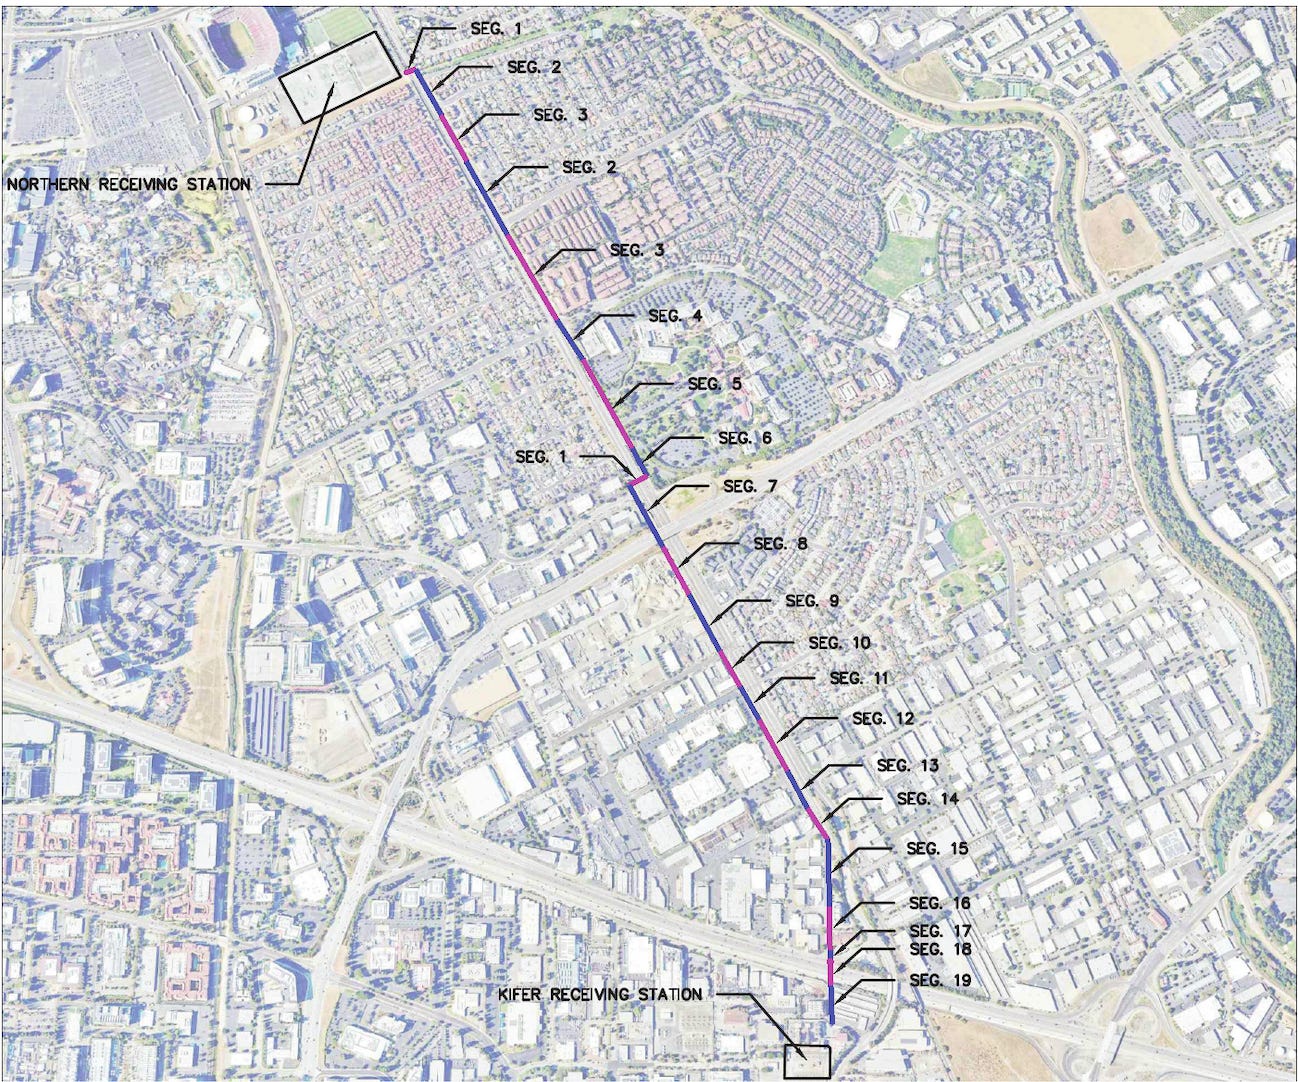
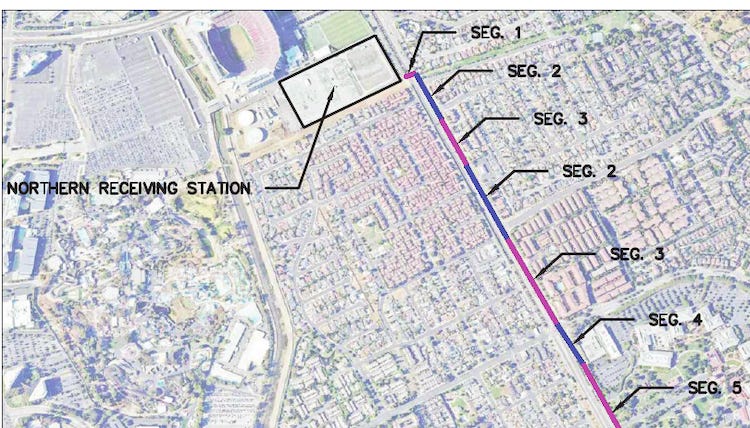
The map SVP published to model fields for Lafayette Street. The stadium is in the corner; the practice facility sits between it and the station.
The load
Before going further into what was built, it is worth stepping back to ask what, exactly, we should be looking for to determine if magnetic fields increased next to the facilities. Substations, power lines, and transformers do not make a magnetic field simply by existing. The field comes from the current flowing through them, and it scales with that current. The question is whether there is more current. A small line carrying a heavy load can create a stronger field than a large one carrying a light load. Current is measured in amps and SVP almost never publishes that number. It does, however, state megawatts. Mergawatts are a measure of power, not current, but in this case that turns out to be all that we need.
The Northern Receiving Station was built at 230/115/60 kV and SVP’s current expansion works on “the 60kV, 115kV, and 230kV buses” — the same three tiers from 2004 to today.²⁶ ²⁷ The fixed voltage at the site is what turns SVP’s records into evidence of increasing fields. Stated simply, power is voltage times current.† If the voltage stays constant, power and current move in lockstep. If power rose 50%, current rose 50% — and so did the magnetic field. Every megawatt figure in SVP’s filings is a current reading in disguise (SVP does the same arithmetic itself: describing the stadium's service, it wrote the two figures as one, "12 MW of capacity - 600 amps @ 12kV").⁶³ And because a line’s limit is set by heat — current through resistance warms the wire — every time SVP replaces a breaker or re-strings a conductor “for capacity,” it is telling you the amps had reached the ceiling of what the hardware could carry.
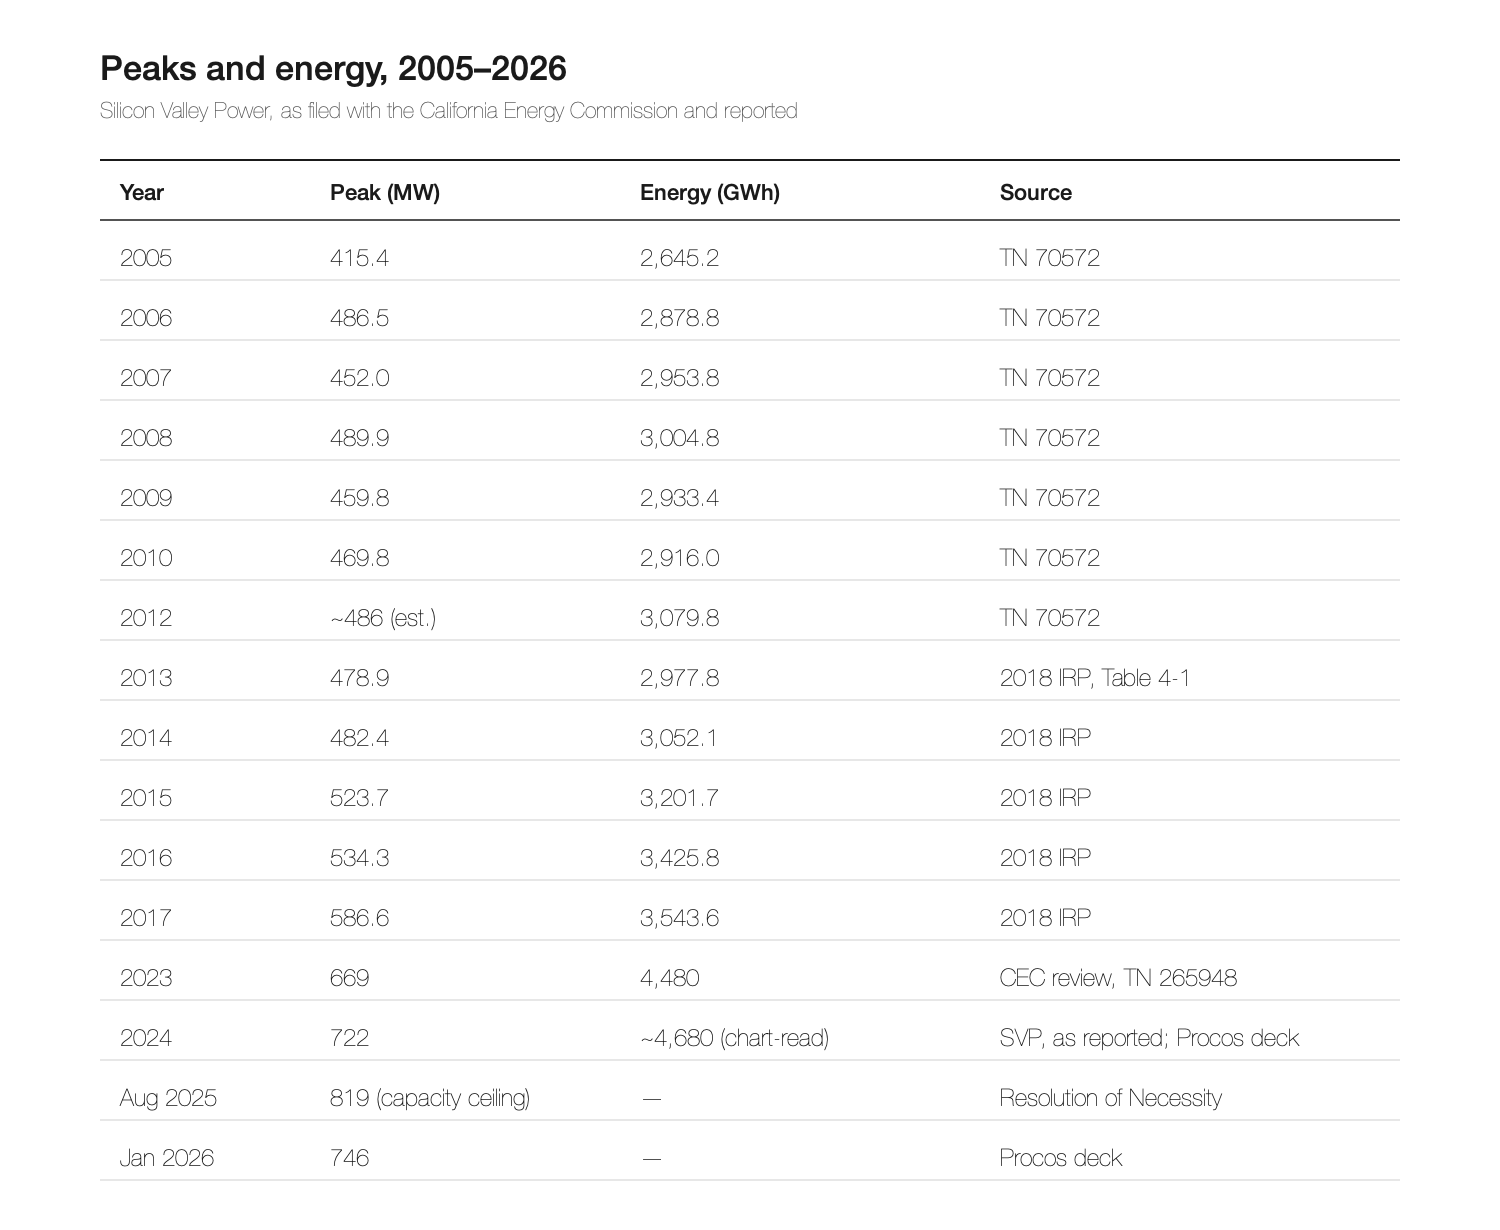
Silicon Valley Power’s system peak was 400.0 MW in 1990 and 399.7 MW in 2004.¹⁰ Essentially flat for 15 years, its load curve started climbing the year the station was energized and has never come back down. SVP’s table of recorded load peaks, filed with the California Energy Commission, shows the flat line ending in 2004 and then rising continuously afterwards:¹⁰ ²⁶
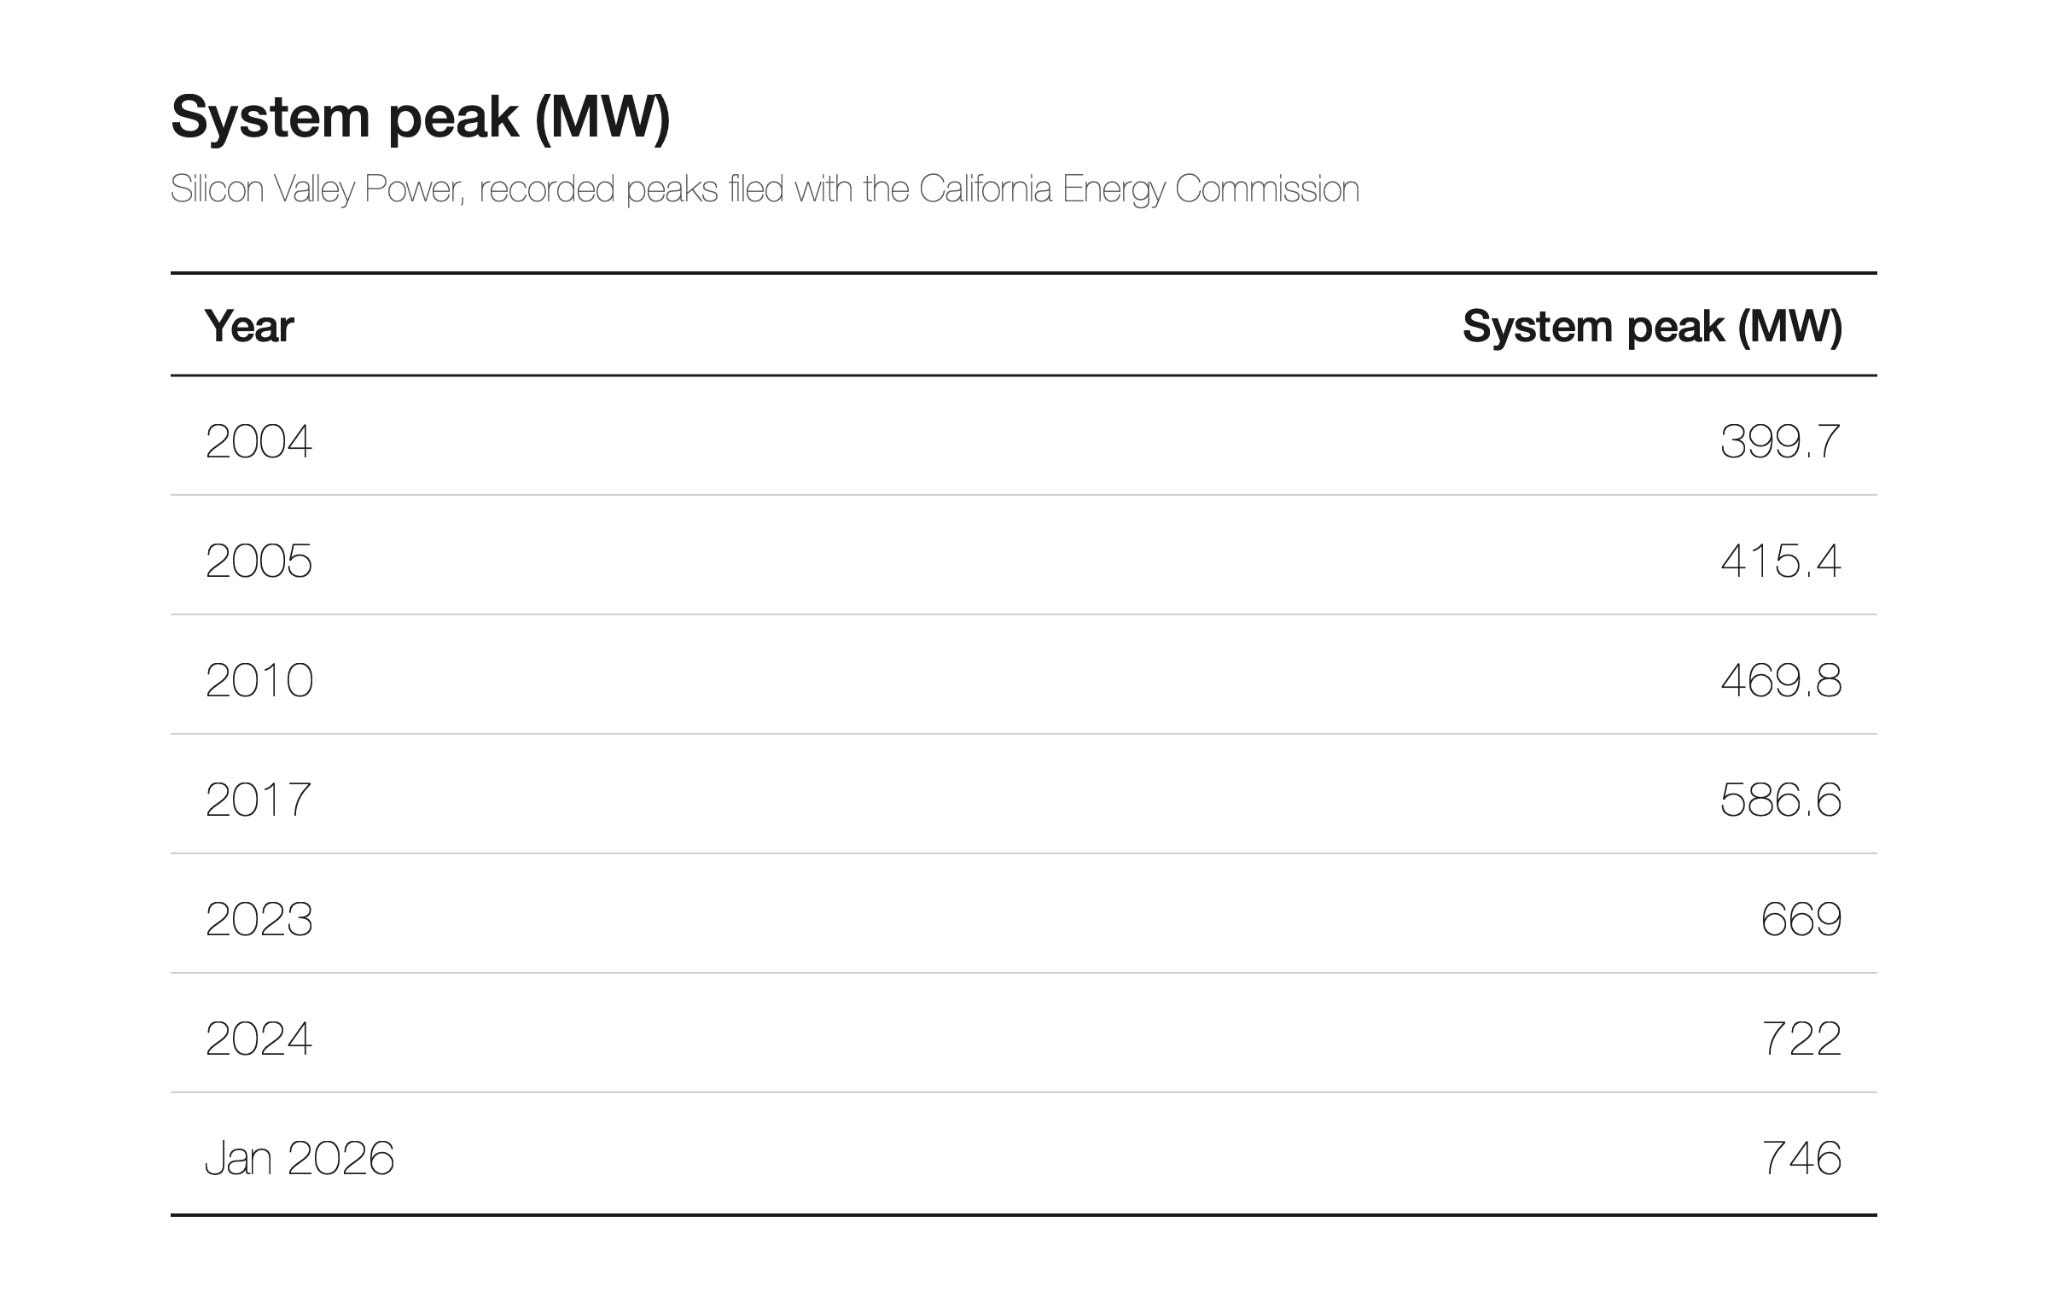
In SVP’s words: “Since 2011, SVP had seen a steady 2 to 3 percent increase in demand, until 2015–2017 when the average growth increased to 5 percent or more each year.” “SVP has set a new peak each year.” And, printed beside its load chart in 2018: “Most electric utilities across the country are in an era of flat or declining load growth.”²⁶ Santa Clara was the exception, and the exception started after 2004
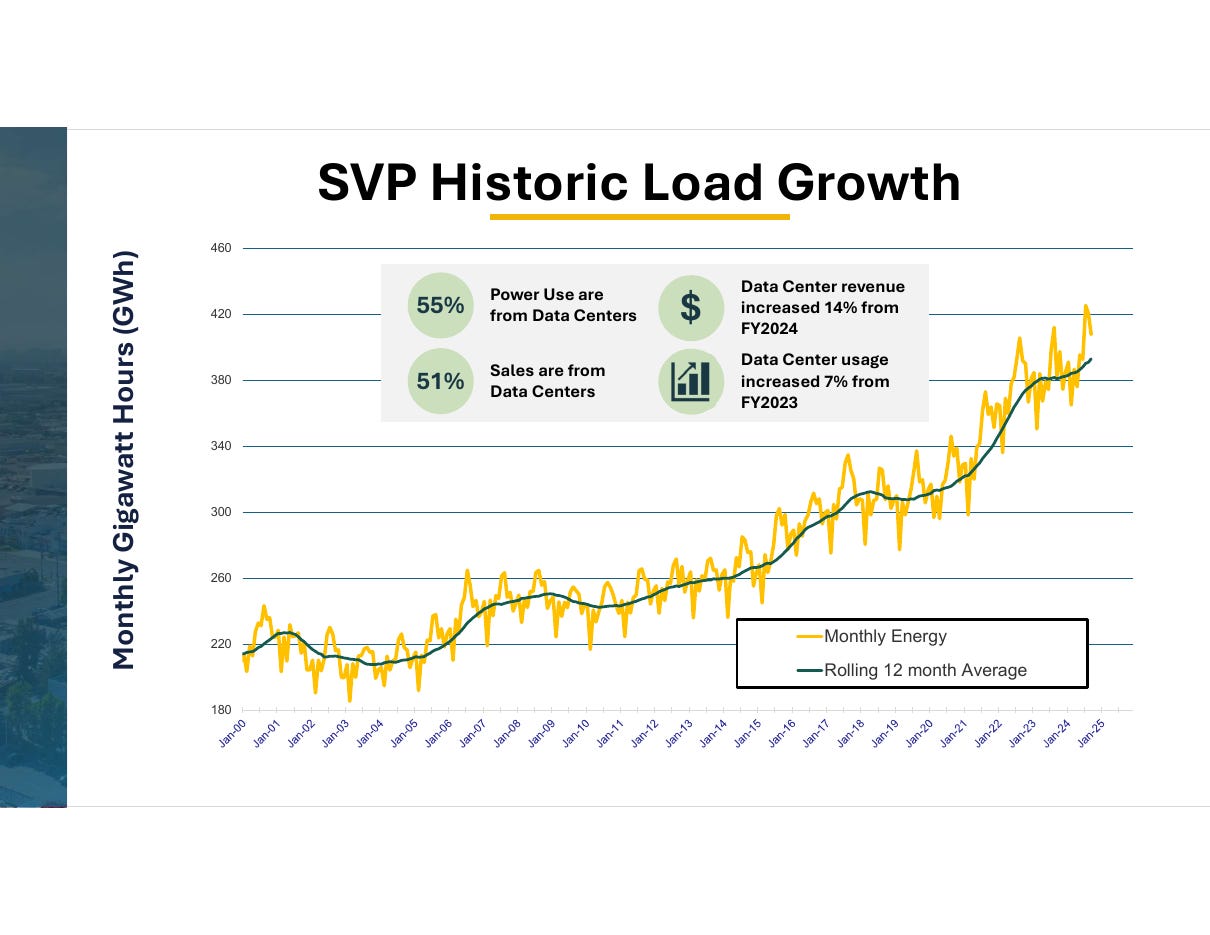
SVP Historic Load Growth — monthly gigawatt-hours, January 2000 to January 2025, with rolling 12-month average. Source: Silicon Valley Power, ‘AI’s Grid Impacts,’ January 28, 2026.
Peak demand is determined by the load in the single hour of the year when the most power is being consumed. For a question about chronic exposure the average load is more important — the day-to-day current — and the average rose in step with the peak: from about 289 MW in 2004 to about 510 MW in 2023 and roughly 535 MW in 2024.²⁸ An average that grows as fast as the peak is the signature of a load that never turns off. (Full peak, energy, and average-load tables in Appendix B.)
In January I posted my theory linking the 49ers’ pattern of soft-tissue injuries to the magnetic fields from the substation beside their practice facility. That pattern began in earnest in 2013. By then the system’s peak was already 15% above where it stood when NRS was energized, on its way to almost 90%.¹⁰ ²⁶ That is a 15% magnetic field increase not even considering any changes to the infrastructure.
Every line in and out of the station carries more current than it did in 2004. NRS is the only place 230 kV power enters Santa Clara — the six-mile line from PG&E lands there, and the city’s only other connection to the outside grid is a 115 kV station at Kifer; its third receiving station, Scott, is fed from NRS.²⁶ As the system grew, the current funneling through this one parcel grew with it, and SVP’s maintenance record at NRS documents this. In the spring of 2018, “SVP completed a breaker replacement project which enabled increased loading for the existing system.”²⁶ A breaker’s rating is an amp rating, and now the station is being expanded “to over 900MVA”²⁷ — megavolt-amperes, the rating stamped on transformers — it works out to about 900 MW of capacity at this station alone, more than the whole system’s record peak of 746 MW, and is accompanied by three new transmission lines terminating there..³² ³⁹ ⁵¹ NRS is, by the utility’s own account, the single most critical point in its system. (The full reinforcement record is in Appendix C.)
SVP does not make a habit of stating ampere figures, but we do have two pertinent examples on record. Once in 2013, when it told an engineering audience that each of the stadium’s 12 kV feeders was sized for 600 amps,⁶³ and once in the environmental study for the Lafayette Street line, which models that single 115 kV circuit at 1,207 amps at peak load — about 240 megawatts on one wire out of the station beside the practice fields, roughly 60% of what the entire city drew at its 2004 peak.⁵¹ That figure is on a different circuit than the line behind the practice facilities, so we can’t assume it carries the same load, but it does tell us the scale of what NRS now puts on a single wire. And the corridor line, at 60 kV instead of 115, needs nearly twice the current to move the same amount of power. That means even stronger magnetic fields.
The other side of the station
The new Lafayette Street line leaves the far side of the Northern Receiving Station, on the east, away from the facilities. On the near side, along the street that fronts the substation and runs directly behind the practice facility, is the line that went in with the stadium.²³ ⁴⁹ It is the same type of line SVP modeled in its Lafayette Street report and it produces a field of the same order.
The stadium project required removing Tasman substation.¹⁸ The city’s plan was to rebuild its capacity beside NRS. What was built instead, a mile south, was Mission — three to five times larger than Tasman: a 60 kV distribution substation with three 50 MVA transformer banks, the largest distribution substation in SVP’s system,²¹ finished a week ahead of a council deadline set “to coordinate with the completion of Levi’s Stadium,” in May 2014.²²
Before the stadium, overhead lines connected NRS to Tasman. The stadium contract required the removal of “all overhead poles, electrical lines and communications lines” between the two stations, and called for a new private access road “South of the 49ers Training Facility and north of the Northern Receiving Station.”²⁴ That road is Bill Walsh Way, and on it, on new steel poles, is the line that now connects NRS to Mission: an overhead 60 kV circuit with a 12 kV distribution “underbuild” — a lower set of neighborhood wires — and a fiber-optic cable on top.²³ It runs from the station along the back of the training facility, behind Levi’s Stadium and then heads south along the creek to Mission substation; SVP’s 2025 filing maps every pole.²³ ⁴⁹ In November 2011 the city told the Stadium Authority that SVP was “relocating electric facilities in proximity to the new Football Stadium site including electric substructures, distribution lines, fiber optic lines, transmission lines, and the removal of Tasman Substation,” and listed “Transmission Steel Poles” among the purchases that work required.⁶⁴ SVP’s slides from May 2013 show the new steel 60 kV poles going up.⁶³ Transmission, distribution, and fiber went onto new steel poles together, on a road that did not exist before the project, right behind the practice facilities.
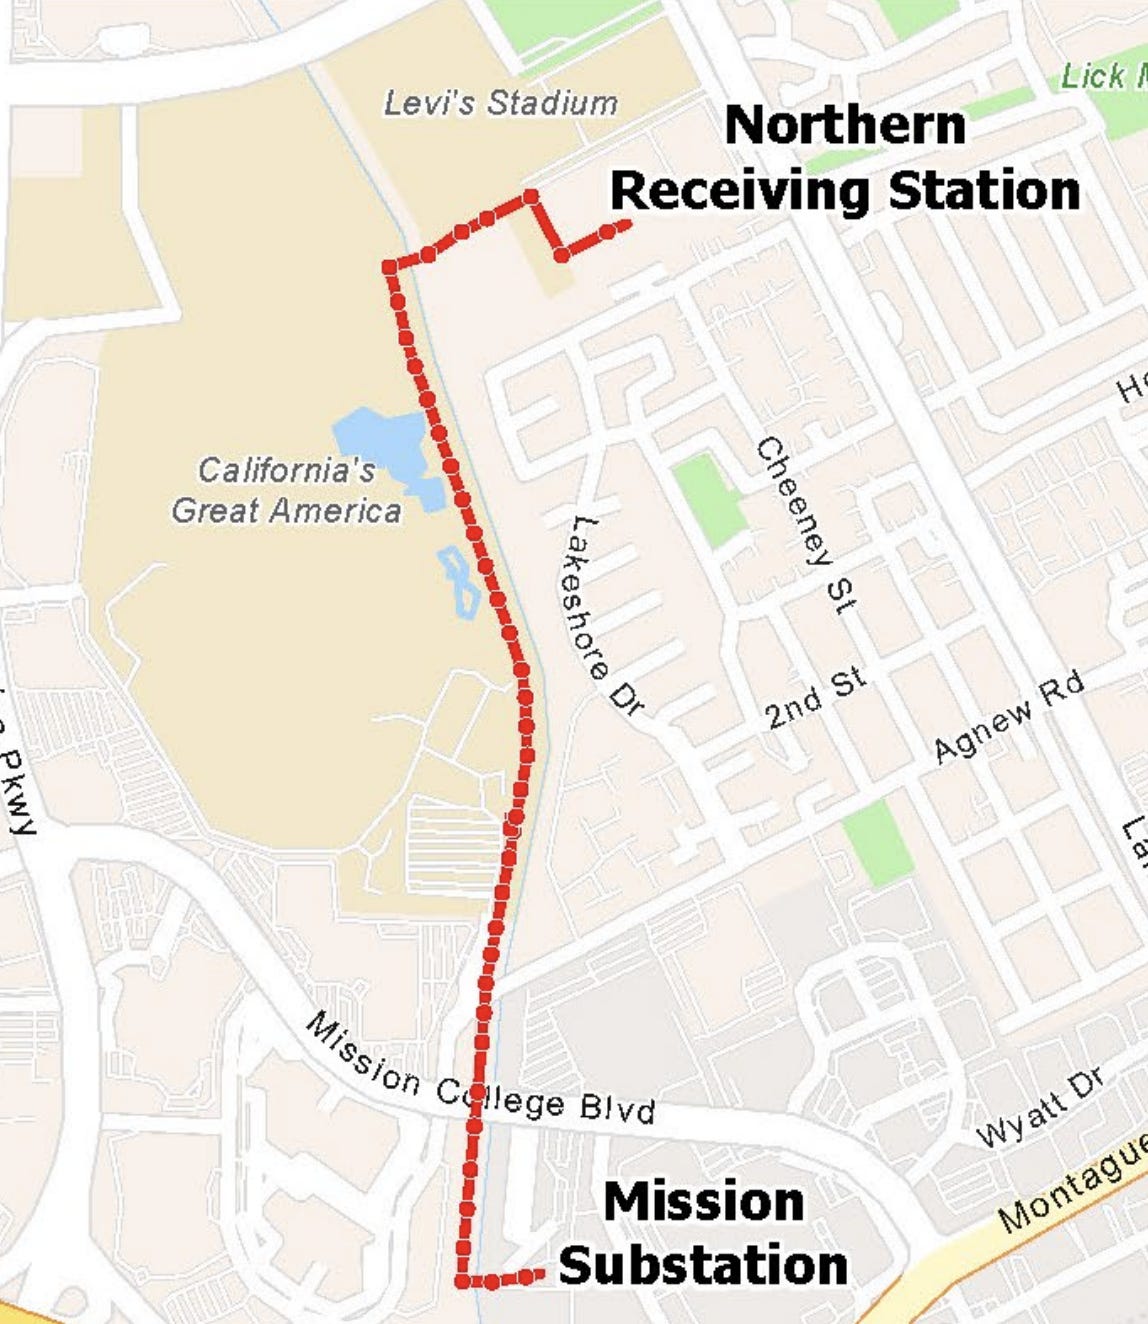
Northwest Loop conductor, NRS to Mission. Red dots are individual poles. Source: SVP Notice of Exemption, SCH 2025090896, Figure 1.
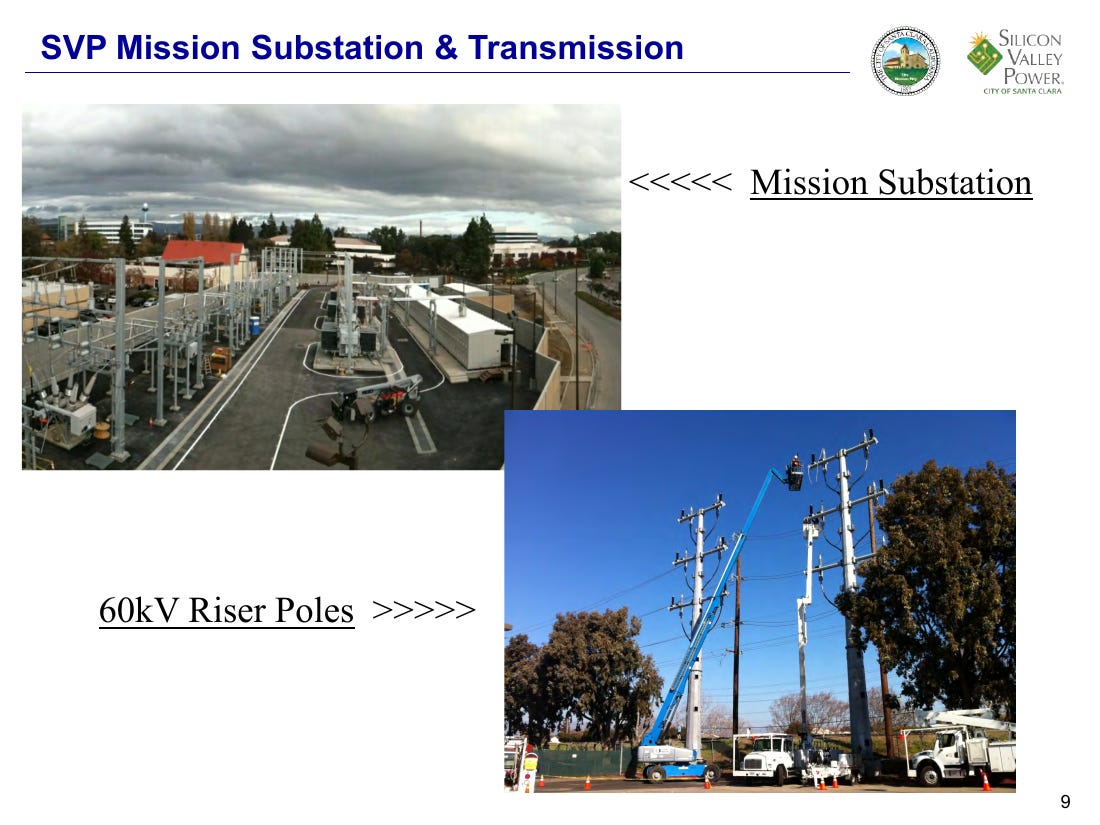
SVP’s photo, May 2013: the new 60 kV riser poles for the Mission line going up during the stadium build-out.
Three more entries in the corridor’s record put additional current on the wires behind the fields:
The stadium’s feeders. The stadium is fed by two dedicated 12 kV services from two substations, each able to carry the whole 12-megawatt building.³
The solar array. A 375-kilowatt array on the stadium’s roof and pedestrian bridges feeds surplus power back onto the neighborhood’s 12 kV circuits, so current now sometimes flows out of the stadium, and its inverters add high-frequency noise to local wiring whenever the sun is up.³ ²⁵
The 2025 re-stringing. The wire that was adequate when it went in during the build-out had, by 2025, become a constraint on the load: SVP filed to rebuild the line, re-stringing it with heavier conductor rated for more current “to provide additional capacity.”²³ The new conductor runs at “higher tensions” and “a higher temperature than the existing conductors”; the 12 kV underbuild on the same poles is being replaced too. The same filing says, in the same document, that the replacement line “would not significantly increase the capacity of the power line” — a statement made to qualify for a categorical exemption from environmental review.²³ The filing scheduled construction for January–February 2026; SVP’s own updates have pushed energization three times, most recently to early 2027.²³ ⁶⁸ The corridor’s amp limit had become the constraint, so SVP is raising it.
The corridor’s current has never been published, but the exact number is not the point. The point is that every factor that determines the strength of the field — the conductor, the current, the load behind it — has only moved in one direction, and that is up. And, as on Lafayette Street, the line is not alone: it sits beside an existing source, and here that source is the receiving station itself.
SVP has made field calculations publicly available for exactly one line in this neighborhood, and it did so only because people complained. No regulation required the study; the environmental document says it was added "due to input received during the public scoping process," after residents along Lafayette Street objected in the spring of 2024.⁵¹ No calculation exists on the public record for the corridor behind the practice facility, because the 49er’s ownership has never publicly complained (though the players certainly have).
Until now, all of the attention has been on the substation, and for good reason. The current through it has risen 87% since 2004, and more current through the same equipment means a stronger magnetic field. But as I have shown, the substation is not the only thing emitting magnetic fields behind the practice facility, and it may not even be the source for the fields that travel the farthest. Substation equipment is compact and clustered, and the fields from its many conductors partially cancel each other out; within the first several dozen feet of the fence line the station is likely creating the strongest field, but it falls off fast. A power line is different. Its three wires are spaced apart, so their fields never fully cancel out, and what remains fades more gradually. What’s more, any current that returns through the ground instead of through a wire has no paired conductor to cancel it at all, making it the slowest-fading field in the system — and the 12 kV under build on these poles, like every American distribution circuit, is built to send part of its return current through the earth. This is why, when fields around substations are actually measured, most of what remains beyond that first perimeter comes from the lines serving the station.
Whether or not anything changed inside the substation fence, the current through the site increased. The magnetic fields increased with it, and a new line beside an existing substation doesn’t just add to the field, it multiplies it. The lines that carry both run directly behind the 49ers’ practice facility.
What put that current on those lines is the subject of the next piece. Stay tuned.
Full exhibits, tables, and the unabridged evidentiary brief are below.
Full correction to my January piece
In January I wrote that the substation beside the practice facility had been expanded alongside Levi’s Stadium. Environmental review documents for the stadium showed plans for a new substation right next to NRS, and a map explicitly labeled it. The “Substation relocation” was officially folded into the project.¹⁹ In April 2010 the city told the council that “a new substation (Esperanca)” would replace Tasman and “will be installed at the City’s existing Northern Receiving Station”; the consultant’s proposal attached to that report put the new station “in the Northern Receiving Station (NRS) site,” on an extension of NRS’s own bus and ground grid.¹⁹ Two months later the budget packet spelled it “Esparanca” and mapped it on a city aerial, on the open parcel between the Gianera gas plant and NRS.¹⁸
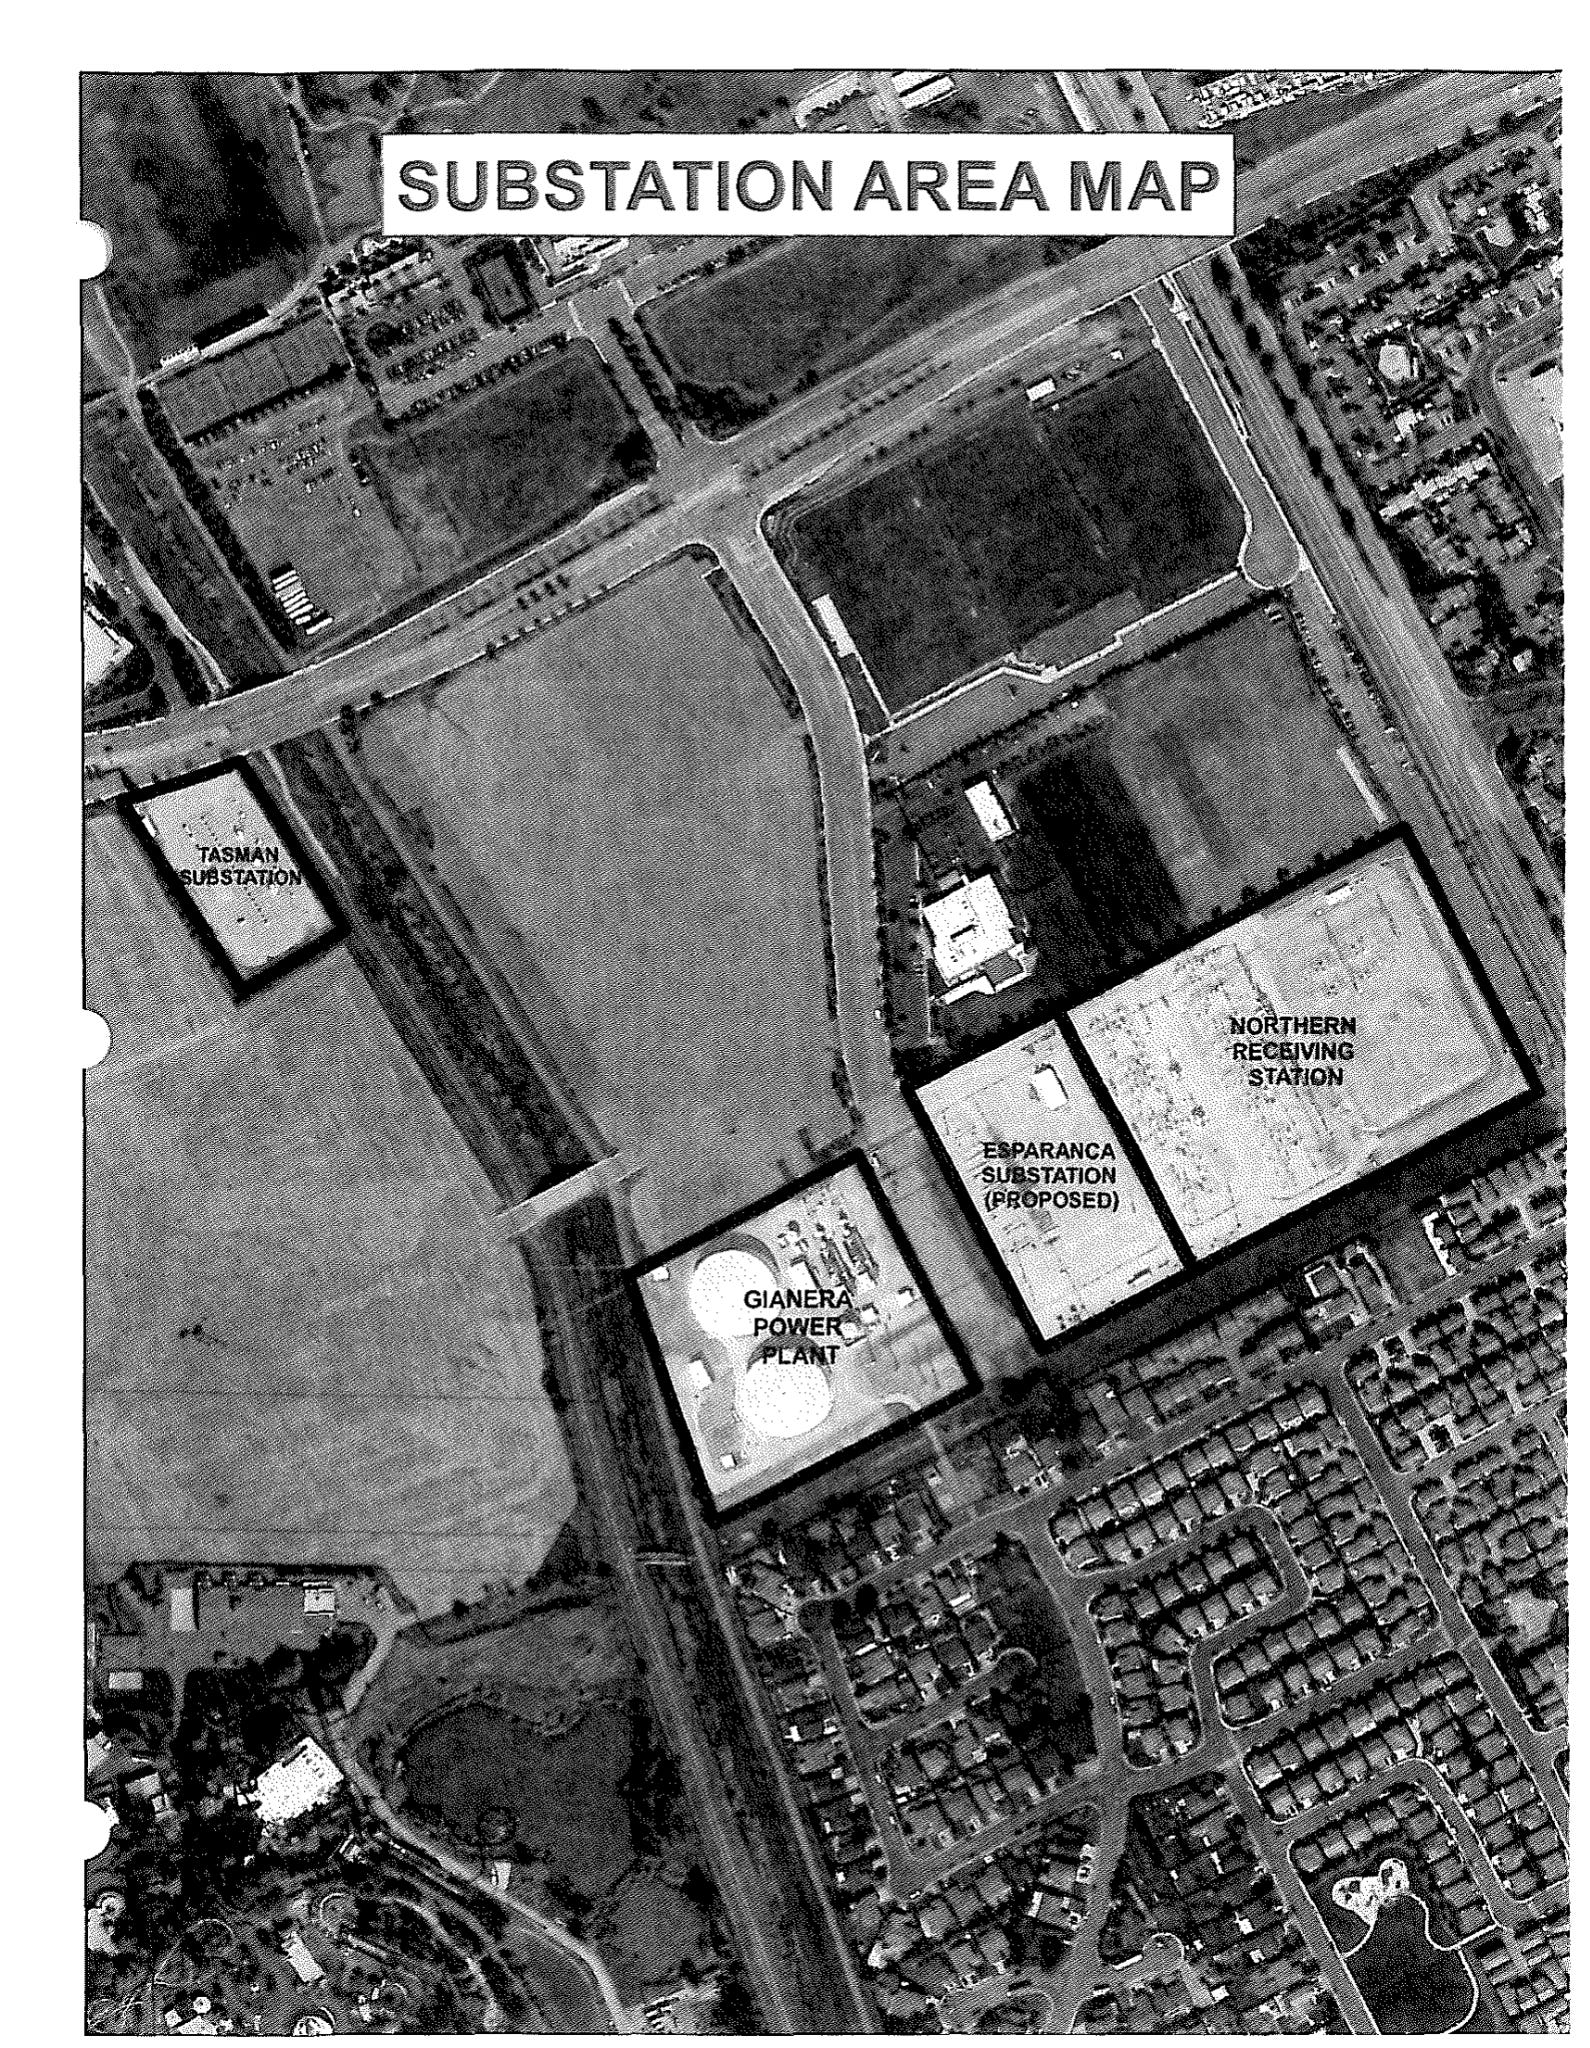
June 2010 budget packet, “Esparanca” area map on the city aerial: the parcel between Gianera and NRS.
Naming was inconsistent across documents, and it was genuinely hard to determine what was actually built, so when I found the press page for the company that had built the Mission Substation to replace Tasman and go online with the opening of the stadium,²¹ I assumed they had just changed the name. I managed to reach an SVP engineer to help clarify the situation, and though they have a policy of not talking directly to the media, I did get confirmation that Esperanca is an ongoing project, and is within the Levi’s Stadium parcel.
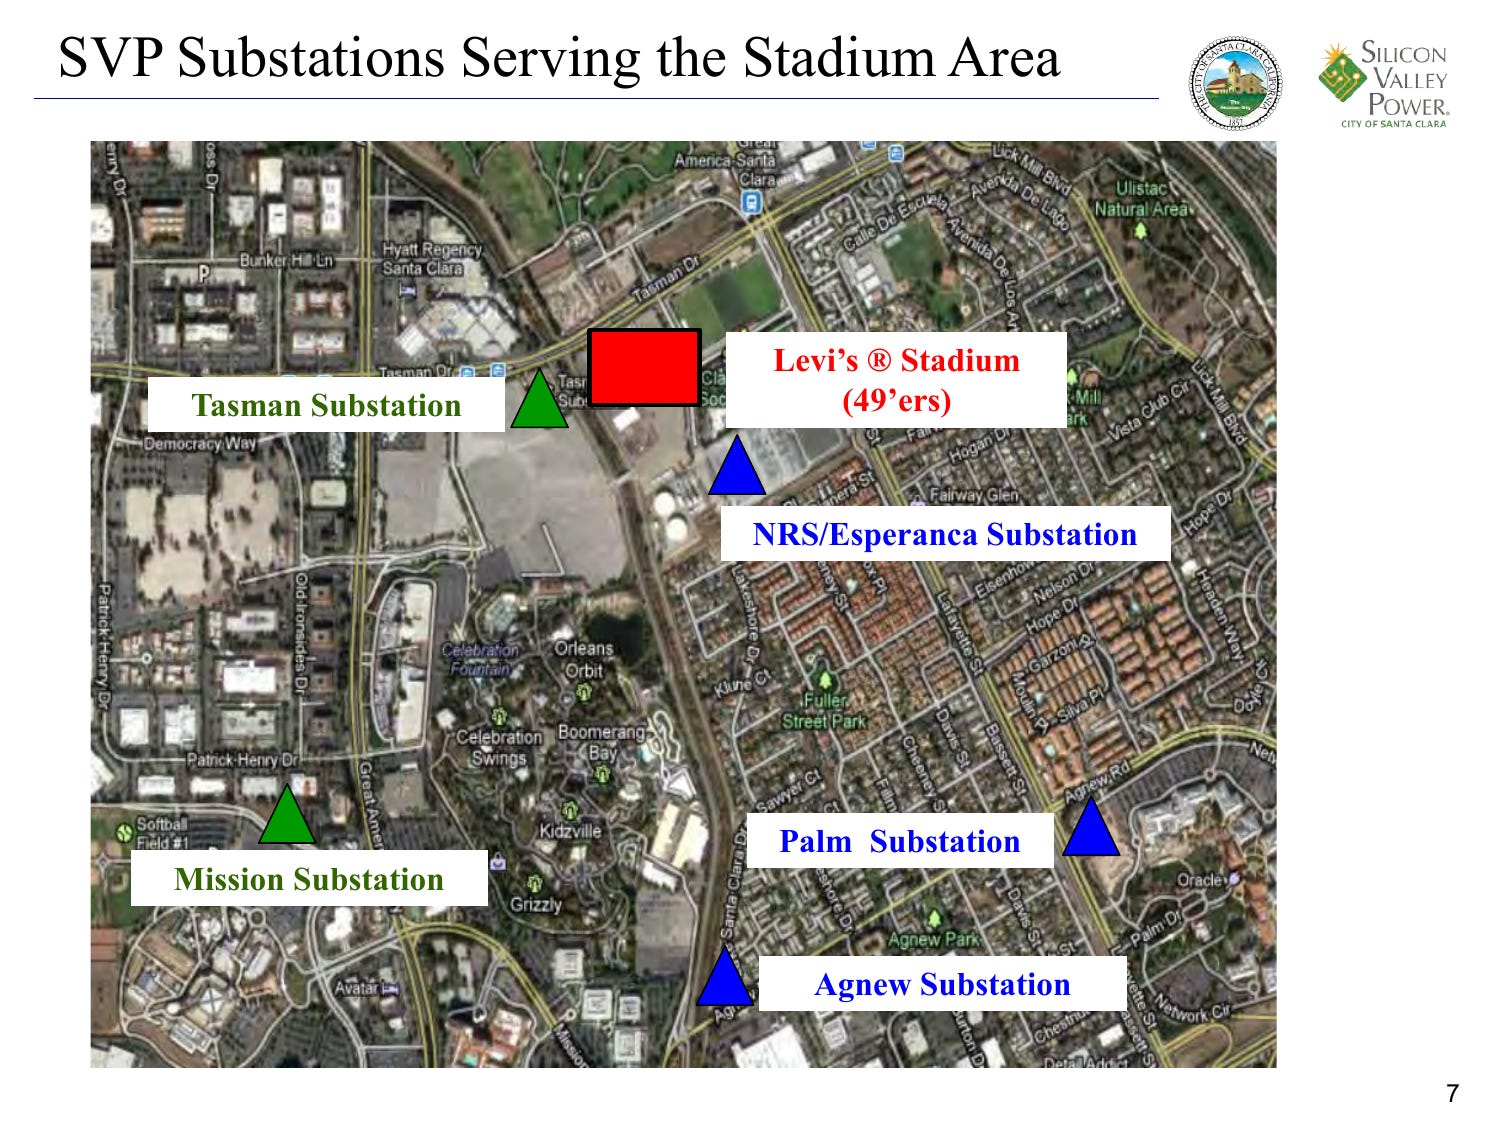
SVP presentation to the IEEE, May 15, 2013, slide 7, “SVP Substations Serving the Stadium Area.
Esperanca is back in SVP’s capital plan, for a different customer this time, not the stadium; see Appendix D.⁴¹ ⁴²
Appendix A — The arithmetic
For three-phase alternating current, P = √3 × V × I × pf: power (watts) equals a geometric constant (≈1.732) times line voltage times current times power factor (an efficiency ratio utilities hold near 1). Solving for current, I = P / (√3 × V × pf). With V fixed at NRS since 2004 and pf regulated near 1, current is directly proportional to power: an 87% rise in MW is an 87% rise in amps.
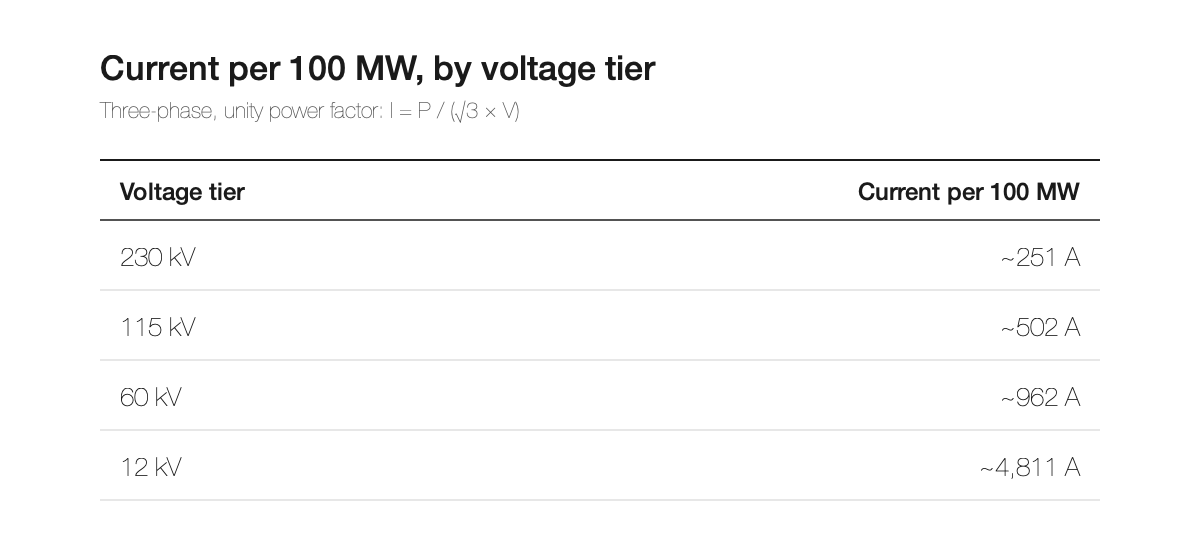
No single 12 kV line carries 100 MW; a conductor’s limit is set by heat (loss ∝ I²R), which is why utilities transmit at high voltage — 230 kV needs ~1/20th the amps of 12 kV for the same power — and step down only near the load, spreading it across many circuits. High-voltage lines are associated with strong magnetic fields not because of voltage but because (a) they carry more total power (500 MW at 230 kV ≈ 1,250 A) and (b) their phases are spaced widely for insulation, so the three fields cancel less. The 12 kV underbuild on the corridor poles carries five times the amps per megawatt and is the lowest, closest wire on the pole.
Appendix B — Load tables
Recorded peaks, 1990–2004 (SVP, CEC TN 70572, Att. 1): 400.0 (1990), 384.9, 373.5, 393.4, 381.6, 396.7, 411.6, 427.0, 456.9 (2000, high), 426.2, 456.9, 437.8, 419.0, 407.2, 399.7 (2004). Net growth: zero.
SVP’s monthly chart (Procos deck, slide 4) sits flat near 210 GWh a month from 2000 through 2004; the climb begins in 2005 and has never reversed; by the end of 2024 the rolling average is near 390 — about 85% above where it started.
Average load (energy ÷ 8,760 h): ~302 MW (2005), ~333 (2010), ~405 (2017), ~511 (2023, tabulated), ~535 (2024, read from the rolling average on SVP’s January 2026 chart — treat as approximate until tabulated). Peak +87% (2004→Jan 2026); average +75–87% (2004→2024). The two series move together, which on this system is the signature of around-the-clock load.
US comparison (EIA MER Table 7.6, retail sales): 2,712.6 TWh (1990) → 3,547.5 (2004), +31%; 3,661.0 (2005) → 3,717.7 (2020), +1.5%; 3,975.4 (2024).
Appendix C — The NRS reinforcement record
Breakers replaced spring 2018, “which enabled increased loading” (2018 IRP §3.6.1.3.2).
“Due to system load growth, SVP is currently evaluating breaker upgrades and installing larger transformers … projected to be completed by end of 2021”; NRS–Scott 115 kV Lines #1 and #2 “upgraded to allow for higher capacity … by April, 2019” (§3.6.1.3.2, §3.6.1.3.4).
Expansion “to over 900MVA” (CIP 2454; $166M in bond funding per SVP’s Feb 2025 council update) — about 900 MW of capacity at this station alone: more than the whole system’s record peak (746 MW), more than its present ceiling (819 MW), and roughly 70% of the 1,300 MW the entire city is being built out to. The hardware is current-rated too: two new 230 kV transformers rated 560 MVA alongside the existing 420, and the 115/60 kV pair going from 372 to 672 MVA, each new unit able to put more than 3,000 amps onto the 60 kV side.⁶⁶ ⁶⁷ ⁶⁸
“SVP is investigating installation of an additional 230kV transformer to provide redundancy to the existing 230 kV transformer … complete in 2026” (§3.6.1.3.2).
New lines terminating at NRS: NRS–KRS 115 kV (2.24 mi, ~$50M, CEQAnet SCH 2024080009, route approved Nov 12, 2024, NOD Dec 2024, construction late 2026); Newark→NRS 230 kV HVDC “Power the South Bay” (~12 mi, 1,000 MW, SCH 2024071095, groundbreaking May 20, 2026, target 2028); NRS→PG&E San José B 230 kV underground (~7 mi, CAISO competitive award to LS Power, in service by June 2030).
The City’s Aug 2025 condemnation resolution for the Kifer line says it explicitly: until the project is completed, “SVP’s system capacity will be limited to 819MW,” and the project is “one of the key projects that are needed to increase SVP’s system capacity to approximately 1300-megawatt (MW).”⁴⁰
Scott and Kifer receiving-station rebuilds: $130M (2024 bonds) + $240M (2026 bonds).
Not in evidence: recorded peaks for 2011–2012; NRS station-level SCADA loading; any documented equipment change at NRS between 2005 and spring 2018; the division of imports among interconnection points; the month the 115 kV station was first energized (bracketed 2001 to September 2003 by source 71.
Appendix D — The corridor inventory, 2010–2026
What was built beside the fields, and what the record leaves open.
Everything in the corridor that could have added current, 2010–2014:
The corridor now supplies a substation three to five times larger than Tasman.
The 60 kV loop rerouted from Tasman into Mission through the corridor. The stadium contract removed “all overhead poles, electrical lines and communications lines” between Tasman and NRS and built the access road south of the training facility;²⁴ the November 2011 agenda report records SVP “relocating electric facilities in proximity to the new Football Stadium site including electric substructures, distribution lines, fiber optic lines, transmission lines,” with “Transmission Steel Poles” purchased under CIP 2401 and 2005;⁶⁴ SVP’s May 2013 slides show the new steel 60 kV riser poles under construction.⁶³
New underground 60 kV line along the Great America maintenance road. Harris & Associates’ account of the Mission project includes a “60kV underground extension … installed along the maintenance road of California’s Great America Park”²² — the strip between the theme park’s parking lot and San Tomas Aquino Creek, across the creek from the stadium’s west side, not behind the practice facility. Whether the buried line continues north to NRS is presumed but undocumented. The November 2011 report lists the Mission project’s transmission line as underground (CIP 2114) and the steel transmission poles as a separate purchase (CIP 2401 and 2005), which makes two circuits — a buried Mission extension and an overhead stadium-relocation line — the likelier reading;⁶⁴ no public document I’ve found states it outright.
Overhead 60 kV pole line with 12 kV underbuild and fiber, on new steel poles, installed during the 2012–2014 build-out: the relocated transmission, distribution, and fiber lines of the November 2011 report, on the road the stadium contract created, ending at a substation energized in May 2014.⁶⁴ ²⁴ ⁶³ ²²
Two dedicated 12 kV stadium feeders, each sized for 12 MW; routing undocumented.
The stadium itself, a 12 MW load on event days. Only one of the two feeding substations (Mission) is named anywhere in the public record. The third “flip of a switch” source is also unnamed; Gianera is the obvious candidate, but I’ve found no document confirming it.
375 kW of solar export plus inverter harmonics. The photovoltaic system on the green roof and pedestrian bridges was part of the plan voters saw in 2010 and was operating when the stadium opened in July 2014.³ ²⁵
Ground-return current on multi-grounded-neutral 12 kV circuits. American distribution circuits, including the 12 kV underbuild on these poles, use a multi-grounded neutral design in which the neutral is bonded to the earth at pole after pole and the earth itself carries part of the return current. The more unbalanced that load is, the more current is routed through the earth, and distortion makes it worse: the harmonic currents that inverters and switching power supplies put on a circuit add up in the neutral instead of cancelling, so they too return through the earth. Each amp of that ground-return current makes a far larger field than an amp on the wires.
More total power through NRS, hence more current on every line in and out.
Esperanca, then and now. The name the city gave in 2010 to a stadium-driven substation on the parcel beside the fields was reassigned in 2016 to a station serving a 240-acre development north of Tasman, approved in 2019 as a $21 million project with the developer paying 40%.⁴¹ It now sits in SVP’s capital plan with three new transformers out to bid and a completion date of June 2027.⁴² Where, exactly, is the one thing the written record doesn’t say: the 2010 report sites Esperanca “at the City’s existing Northern Receiving Station”; the 2019 approval says only that it “will serve the development site at 5155 Stars and Stripes Drive”; SVP’s 2023 and 2025 documents give no address. An SVP representative, clarifying a public-records request of mine, confirmed Esperanca as a distinct facility associated with the Gianera parcel, but would offer no further details.
Undocumented: routing of the two feeders; identity of the second feeding substation; identity of the third source; the placement of each CIP 2401 pole (no document names Bill Walsh Way); the corridor line’s current; written SVP confirmation of Esperanca’s history. Spelling: the 2010 city memo spells it “Esparanca”; SVP’s 2023–2024 documents use “Esperanca,” which I use throughout.
Appendix E — SVP’s field model (NRS–Kifer 115 kV, IS/MND Appendix G)
Method, as stated by SVP’s contractor. Resultant RMS magnetic field, 1 m above ground, at 10-ft intervals to ±60 ft from the new line’s centerline, computed in PLS-CADD per the EPRI AC Transmission Line Reference Book. Nineteen segments, one per unique combination of pole framing and nearby circuits (Attachment C maps them: Segments 1–3 on Lafayette through the residential grid southeast of NRS; Segment 7 at the Montague Expressway crossing; Segments 8–11 on Bassett Street; 12–19 on Duane Avenue to Kifer). “Existing 2024” = nearby circuits only; “Future 2028” = the same circuits plus the new 115 kV at 1,207 A peak (965.6 A “normal,” defined as 80% of peak). Phasing chosen so fields do not cancel; minimum conductor heights used. Existing circuits are assigned identical currents in 2024 and 2028 — i.e., the model assumes no growth on any existing wire over four years, in a system the utility says will nearly double.⁵¹
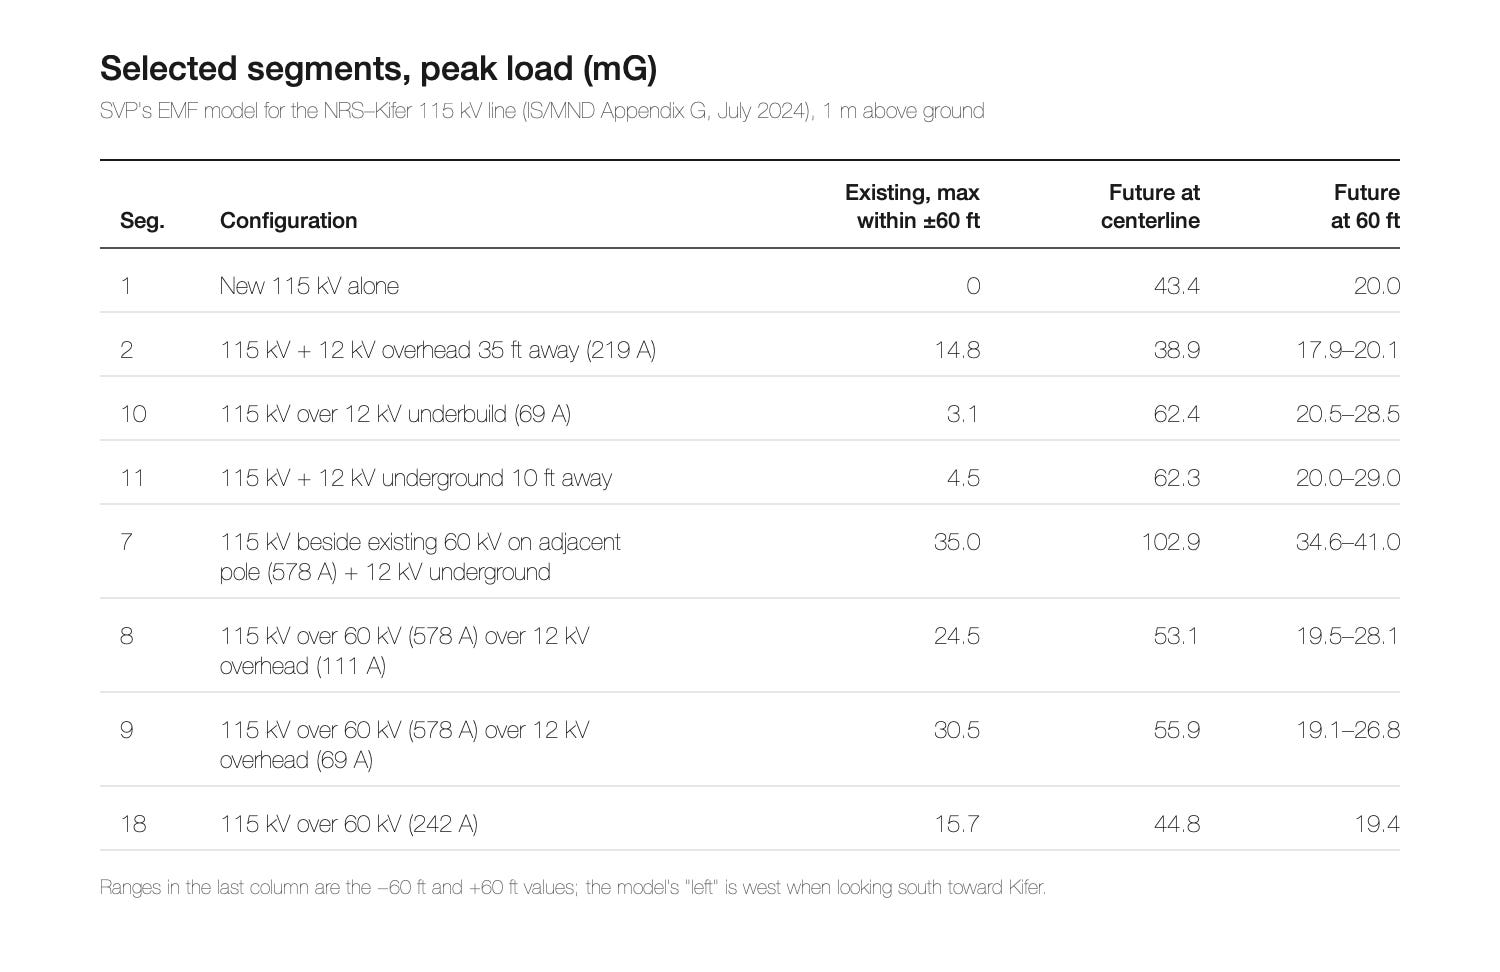
Ranges in the last column are the −60 ft and +60 ft values; the model’s “left” is west when looking south toward Kifer.
What the “existing” columns say about a 60 kV line with underbuild. Segments 7–9 model a 60 kV circuit (715 kcmil ACCR bundled — the conductor specified for the Northwest Loop re-stringing, now targeted for early 2027) carrying 578 A peak with a 12 kV underbuild: 24.5–35.0 mG at or near the centerline and 5.9–14.0 mG at ±60 ft, before the 115 kV is added. Two of the three segments carry the 60 kV circuit on the same poles as the new line; the third (Segment 7) has it on a neighboring pole. The 103 mG at the Montague Expressway crossing is Segment 7: the existing 60 kV circuit plus the new line beside it. Across all three, adding the 115 kV line takes the field beneath the poles from 25–35 to 53–103, and from 6–14 to 19–41 sixty feet out, at peak load. At 242 A (Segment 18) the same framing gives 15.7 mG at centerline and 4.2 mG at 60 ft. Between those two cases the field scales close to linearly with current — roughly 5–6 mG per 100 A at centerline and about 2 mG per 100 A at 60 ft — which is the basis for the scale used in the body. The Northwest Loop’s current is not public.
Reference points (1 μT = 10 mG): typical U.S. home, about 1 mG; pooled epidemiology, childhood leukemia association at ≥3–4 mG (basis of IARC Group 2B, 2002);⁵⁸ Netherlands advisory for new lines where children spend time, 4 mG; Switzerland, 10 mG at places of sensitive use for new installations; Italy, 30 mG quality objective for new lines, 100 mG attention value;⁶⁰ Sweden (Svenska kraftnät policy), 4 mG for new lines where people live, and offers to purchase homes above 40 mG from existing lines at permit renewal;⁶¹ U.S. state right-of-way-edge limits, Florida 150–250 mG and New York 200 mG, California none;⁶² ICNIRP 2010 general-public reference level, 2,000 mG.⁵⁹
Full segment-by-segment tables: citations/51a.
Notes
† The exact three-phase formula and the per-tier current table are in Appendix A.
The Layette report’s circuit catalog lists the 60 kV circuits it modeled at 578 and 242 amps as “715 kcmil ACCR, bundled” — the conductor SVP’s 2025 filing names for the corridor re-stringing.⁵¹ ²³ At 578 amps those circuits run near a fifth of that bundle’s thermal capacity: 3M rates the neighboring sizes at 1,453 and 1,692 amps per conductor at its 210°C operating temperature, so a two-conductor 715 bundle is on the order of 3,000 amps, against roughly 700 to 900 for a conventional 60 kV wire.⁶⁹ The old corridor conductor is not named in any document, and a line’s operating limit can be set by breakers or clearances rather than the wire.
Sources
Gaps in the number sequence below are due to this originally being a much longer piece which I broke out into two pieces.
3. High Performing Buildings magazine, Jim Mercurio and Emily Lucas, “Levi’s Stadium, Santa Clara, Calif.,” May 1, 2018 (“The two sources of 12 KV are fed from two independent electrical high voltage switching substations”; the solar system “feeds back into the electrical grid”). https://www.hpbmagazine.org/levis-stadium-santa-clara-calif/ ; Orville Plum, Silicon Valley Power, “SVP Electric Service to New Stadium,” IEEE, May 15, 2013, slides 10–11 (“two (2) 12kV circuits @ 600 amps each……Dedicated for the stadium on event days”; “Each feeder will be able to carry the full peak demand”; “Circuit Feeders will come from different Stations”); see source 63. https://ewh.ieee.org/r6/scv/pes_ias/2013%20Events/IEEEStadiumPresentationMay2013.pdf ; CBS San Francisco, “49ers Santa Clara Stadium Boosters: Power Outage Won’t Happen Here,” February 5, 2013 (“two new electrical substations, only one of which is needed”; a third source “at the flip of a switch”). https://www.cbsnews.com/sanfrancisco/news/49ers-santa-clara-stadium-boosters-power-outage-wont-happen-here/
10. Silicon Valley Power, Electricity Demand Forecast, CEC Docket 13-IEP-1C, TN 70572, April 30, 2013, Attachment 1 (recorded peaks and annual consumption, 1990–2010). https://efiling.energy.ca.gov/GetDocument.aspx?tn=70572 ; SVP Energy and Demand Forecast Report, Docket 09-IEP-1C, TN 50182, February 2009. https://efiling.energy.ca.gov/GetDocument.aspx?tn=50182&DocumentContentId=8335 ; SVP Energy and Demand Forecast Report 2015, Docket 15-IEPR-03, TN 204828-3, June 1, 2015, Attachment 1 (recorded peaks through 2014, including 2013: 478.9 MW). https://efiling.energy.ca.gov/GetDocument.aspx?tn=204828-3&DocumentContentId=21085
11. U.S. EIA, Monthly Energy Review, Table 7.6, “Electricity End Use and Electric Vehicle Use” (sales to ultimate customers). https://www.eia.gov/totalenergy/data/browser/index.php?tbl=T07.06
14. CEQAnet SCH 2002032143, City of Santa Clara, “Northern Receiving Station 230kV Transmission Project” (Notice of Preparation, March 26, 2002; Notices of Determination, February and August 2003). https://ceqanet.lci.ca.gov/2002032143 ; City of Santa Clara, staff report awarding Contract 2454 (NRS Upgrades and Expansion), File 25-417, July 8, 2025 (“NRS was constructed over 20 years ago in 2002”). https://santaclara.legistar.com/LegislationDetail.aspx?ID=7455917&GUID=BFCA1DB6-674A-46E6-8CFF-0BC1D8A7652A&FullText=1
18. City of Santa Clara, agenda report and attachments for the June 15, 2010 budget public hearing, including the June 10, 2010 memo “Response to City Council Questions” (p. 6: “Approximate Age of Electric Distribution Substations: … 1976 Tasman-Relocating to NRS site (Esperanca)”), the June 7, 2010 memo “Council Inquiry regarding Noise Impact of Tasman Substation Relocation,” and the “Substation Area Map” (p. 9: “ESPARANCA SUBSTATION (PROPOSED)”). https://www.santaclaraca.gov/home/showpublisheddocument/3267/635713044859030000 ; archived: http://web.archive.org/web/20161111091352/http://santaclaraca.gov/home/showdocument?id=3267 ; City of Santa Clara, agenda report and slides on Tasman Substation relocation, May 2007 (“The proposed 49er Stadium would require the relocation or reconfiguration of Tasman”). https://www.santaclaraca.gov/home/showpublisheddocument/14703/635713044859030000
19. City of Santa Clara, agenda report, “Replacement of Tasman Substation with Esperanca Substation,” April 19, 2010 (Council, April 27, 2010), with the attached MTH Engineering proposal of March 24, 2010. https://www.santaclaraca.gov/home/showpublisheddocument/2646/635713044859030000 ; City of Santa Clara, Notice of Preparation of an EIR, 49ers Santa Clara Stadium Project, February 2009 (“Substation Relocation” as a project component; equipment “may be relocated to the west end of Silicon Valley Power’s Northern Receiving Station”). http://web.archive.org/web/20150922042322/http://santaclaraca.gov/home/showdocument?id=13033 ; Statement to City Council by the treasurer of Santa Clara Plays Fair, Agenda Item 5B2, May 11, 2010, with an attached slide from Agenda Report Item 5A-2, May 29, 2007. https://www.santaclaraca.gov/home/showpublisheddocument/2653/635713044859030000
21. Power Pros, “SVP – Mission Substation,” May 26, 2014 (“largest substation in the SVP system. 60kV substation, three 50MVA transformer banks”). https://powerpros.net/portfolio/city-of-santa-clara-silicon-valley-power-mission-substation-project/
22. Harris & Associates, “Silicon Valley Power Program Management and Construction Management Services.” https://www.weareharris.com/projects/ca/silicon-valley-power-program-management-and-construction-management-services/
23. City of Santa Clara / SVP, Northwest Loop Capacity Upgrades Project, Notice of Exemption and Project Description, signed August 29, 2025 (posted September 19, 2025), SCH 2025090896. Project page: https://ceqanet.lci.ca.gov/2025090896/2 ; document: https://ceqanet.lci.ca.gov/2025090896/2/Attachment/WthH5Z
24. Disposition and Development Agreement, Exhibit J (Scope of Development). http://49ers.savesantaclara.org/DDA/DDA_Exhibit_J.php
25. Cupertino Electric, Levi’s Stadium project page (“a 375-kilowatt (kW) solar photovoltaic (PV) system on the ‘green roof’ and pedestrian bridges”). https://www.cei.com/our-work/levis-stadium-san-francisco-49ers ; Levi’s Stadium, “NRG Energy Innovations Help Make Stadium Eligible for LEED Gold Certification,” July 16, 2014 (solar terrace and three bridges “generating more than 375 kW”). https://www.levisstadium.com/2014/07/nrg-energy-innovations-help-make-stadium-eligible-leed-gold-certification/ ; Levi’s Stadium, Wikipedia (2010 stadium design: green roof and photovoltaic panels). https://en.wikipedia.org/wiki/Levi%27s_Stadium
26. SVP, Final 2018 Integrated Resource Plan (Black & Veatch, November 12, 2018; revised 2019), §2.2, §3.6, §3.6.1.3.2, §3.6.1.3.4, §4.1, Table 4-1, Figure 2-2. https://www.siliconvalleypower.com/home/showpublisheddocument/62481/637268684502400000 ; CEC copy: https://efiling.energy.ca.gov/GetDocument.aspx?DocumentContentId=65979&tn=233449-6
27. SVP Capital Project sheet, CIP 2454, “Northern Receiving Station (NRS) Upgrades and Expansion.” https://www.siliconvalleypower.com/home/showdocument?id=85051 ; Silicon Valley Voice, “Silicon Valley Power Plans Big Strides to Accommodate Growth this Year,” February 2025 (“$166 million in bond money will fund upgrades and expansion to SVP’s northern receiving station”). https://www.svvoice.com/silicon-valley-power-plans-big-strides-to-accommodate-growth-this-year/ ; David Alexander, Silicon Valley Voice, “Santa Clara’s Electric Utility Connectivity Increases,” July 14, 2026 (NRS upgrade $148.5M, completion June 2028). https://www.svvoice.com/santa-claras-electric-utility-connectivity-increases/
28. Derived: annual energy ÷ 8,760 h; see Appendix B. Annual energy for 2005 and 2010 from source 10; 2017 from source 26, Table 4-1.
32. Nico Procos, Electric Utility Director, Silicon Valley Power, “AI Energy Impacts: AI’s Grid Impacts,” California State Assembly, January 28, 2026 (slide 2, “746 MW Peak Demand”; slide 4, “SVP Historic Load Growth”). https://autl.assembly.ca.gov/system/files/2026-01/svp-nico-procos-012826-ai-grid-impacts.pdf
39. CEQAnet SCH 2024080009 (NRS–KRS 115 kV). https://ceqanet.lci.ca.gov/2024080009 ; CEQAnet SCH 2024071095 (Power the South Bay). https://ceqanet.lci.ca.gov/2024071095 ; SVP comment letter on the Power the South Bay Draft EIR, July 24, 2025. https://ia.cpuc.ca.gov/environment/info/esa/psb/pdfs/11_SVP.pdf ; LS Power, “California ISO Selects LS Power Affiliate for New Competitive Transmission Project in the Bay Area,” April 20, 2026. https://www.lspower.com/news/california-iso-selects-ls-power-affiliate-for-new-competitive-transmission-project-in-the-bay-area/ ; City of Santa Clara, “SVP Breaks Ground on Power the South Bay Project,” May 22, 2026 (“one of three major transmission projects that will interconnect at Silicon Valley Power’s Northern Receiving Station”). https://content.govdelivery.com/accounts/CASANTACLARA/bulletins/4189a09
40. City of Santa Clara, Resolution of Necessity No. 25-9482, NRS–KRS 115 kV Transmission Project (3508–3550 Bassett Street), File 25-820, adopted August 19, 2025. https://santaclara.legistar.com/LegislationDetail.aspx?ID=7514762&GUID=11EE1531-D48A-4ED8-962D-2C45B7730B42
41. Janice Bitters, “Santa Clara approves affordable for-sale homes, electricity deal for ‘Related’ project,” San José Spotlight, December 2, 2019 (updated April 9, 2020). https://sanjosespotlight.com/santa-clara-to-vote-on-affordable-for-sale-homes-electricity-deal-for-related-project/ ; City of Santa Clara, staff report, File 19-1355, December 3, 2019. https://santaclara.legistar.com/LegislationDetail.aspx?ID=4249970&GUID=7F197CBB-F8E3-4B99-B633-1FEE947FDD1A&FullText=1 ; Esperanca Substation agreement with Related, Exhibit B (estimated total $21,165,021). https://santaclara.legistar1.com/santaclara/attachments/15eeabee-fced-4e23-8275-1cd7a7020512.pdf
42. SVP Quarterly Update to City Council, RTC 23-757, July 18, 2023. https://santaclara.legistar.com/View.ashx?M=F&ID=12165328&GUID=2AFE01ED-94CC-4BD4-99BF-6F2BF9081A44 ; City of Santa Clara, RFP 24-25-19, “High Voltage Transformers for the Esperanca Substation,” December 9, 2024. https://www.bidnetdirect.com/california/cityofsantaclara/solicitations/High-Voltage-Transformers-for-the-Esperanca-Substation/0000370373 ; SVP comments to the CEC, December 1, 2023, TN 253461, Attachment 2 (“2418-0000 Esperanca Substation 06.30.2027”). https://efiling.energy.ca.gov/GetDocument.aspx?tn=253461&DocumentContentId=88666
47. Silicon Valley Power, “Projects” — 115kV Transmission Line from Northern Receiving Station to Kifer Receiving Station (“City Council meeting on October 8, 2024 … well attended by residents with concerns … continued the item”). https://www.siliconvalleypower.com/svp-and-community/projects ; archived: https://web.archive.org/web/20260730030644/https://www.siliconvalleypower.com/svp-and-community/projects ; City of Santa Clara, staff report RTC 24-751, October 8, 2024. https://santaclara.legistar.com/LegislationDetail.aspx?ID=6885569&GUID=0574FA1D-6E06-45BF-8319-D29EEBA0DE63 ; David Alexander, Silicon Valley Voice, “Health Concerns Delay Power Transmission Project,” October 15, 2024. https://www.svvoice.com/health-concerns-delay-power-transmission-project/ ; CEQAnet SCH 2024080009. https://ceqanet.lci.ca.gov/2024080009
49. SVP Capital Project sheet, CIP 2455, “NRS-KRS 115kV Transmission Line” (address: 4952 Bill Walsh Way). https://www.siliconvalleypower.com/home/showdocument?id=85053 ; SVP, Notice of Public Scoping Meeting, NRS-KRS 115 kV Transmission Line Project, April 2024 (NRS “located south of the intersection of Bill Walsh Way and Lafayette Street”). https://www.siliconvalleypower.com/home/showpublisheddocument/83549/638477381107200000
50. David Alexander, Silicon Valley Voice, “New Transmission Line Will Fuel SVP Growth,” November 13, 2024 (Mezei quote; 4–1 vote). https://www.svvoice.com/new-transmission-line-will-fuel-svp-growth/ ; City of Santa Clara, staff report RTC 24-751, October 8, 2024, p. 4 (“60 mG near vacuum cleaners”). https://santaclara.legistar.com/LegislationDetail.aspx?ID=6885569&GUID=0574FA1D-6E06-45BF-8319-D29EEBA0DE63
51. Electrical Consultants Inc., NRS-KRS 115 kV Transmission Line Project — EMF Report, Appendix G to the Draft IS/MND, July 2024 (Attachment A, p. 7: circuit currents and conductors; Tables 1–19, pp. 13–31). https://files.ceqanet.lci.ca.gov/303919-1/attachment/QB0w04xJxb4uZLtDjAzU9-njfIp-hHHPHWWJrzkvsx9nvX9rogUI9URPwWorBY8xTbELZW64KLyrYbYm0 ; full Draft IS/MND: https://files.ceqanet.lci.ca.gov/303919-1/attachment/xGJ2YdE78MYHeSX5p00Dw2iRUbY0pNXEa07zezfrJAdvn732kagzz7ddxI3QSx3N6tbKibPf2h-MsvWD0
52. Exponent, “Gabor Mezei, Ph.D., Principal Scientist, Health Sciences.” https://www.exponent.com/people/gabor-mezei ; Peter Anthony Cowan, “The Electrical Substation, Deflategate, and an ‘Independent Scientist,’” Living Energy (Substack), April 10, 2026. https://peteranthonycowan.substack.com/p/the-electrical-substation-deflategate ; Myron Levin and Paul Feldman (FairWarning), “Big Companies in Legal Scrapes Turn to Science-for-Hire Giant Exponent,” Business Ethics, December 13, 2016. https://business-ethics.com/2016/12/13/1724-big-companies-in-legal-scrapes-turn-to-science-for-hire-giant-exponent/
58. Ahlbom A. et al., “A pooled analysis of magnetic fields and childhood leukaemia,” British Journal of Cancer 83(5):692–698 (2000). https://doi.org/10.1054/bjoc.2000.1376 ; Greenland S. et al., “A pooled analysis of magnetic fields, wire codes, and childhood leukemia,” Epidemiology 11(6):624–634 (2000). https://doi.org/10.1097/00001648-200011000-00003 ; IARC Monographs Vol. 80, Non-Ionizing Radiation, Part 1: Static and Extremely Low-Frequency (ELF) Electric and Magnetic Fields (2002), §5.2. https://publications.iarc.who.int/98
59. ICNIRP, “Guidelines for limiting exposure to time-varying electric and magnetic fields (1 Hz – 100 kHz),” Health Physics 99(6):818–836 (2010), Table 4 and pp. 824, 830. https://www.icnirp.org/cms/upload/publications/ICNIRPLFgdl.pdf ; NIEHS, EMF: Electric and Magnetic Fields Associated with the Use of Electric Power (June 2002), pp. 32–33. https://www.niehs.nih.gov/sites/default/files/health/materials/electric_and_magnetic_fields_associated_with_the_use_of_electric_power_questions_and_answers_english_508.pdf
60. Switzerland, Verordnung über den Schutz vor nichtionisierender Strahlung (NISV), 23 December 1999, Annex 1, paras. 14–15. https://www.fedlex.admin.ch/eli/cc/2000/38/de ; Netherlands, VROM, “Advies met betrekking tot hoogspanningslijnen,” October 3, 2005 (revised 2023). https://www.rivm.nl/sites/default/files/2018-11/beleidsadvies%20VROM%202005_1.pdf ; Italy, DPCM 8 July 2003, Arts. 3–4. https://www.gazzettaufficiale.it/eli/id/2003/08/29/03A09749/sg
61. Svenska kraftnät, “Our magnetic field policy” (archived November 2023). https://web.archive.org/web/20231124185952/https://www.svk.se/en/stakeholders-portal/community-planning/our-magnetic-field-policy/ ; current policy (Swedish): https://www.svk.se/om-oss/hallbarhet/dialog-och-miljohansyn-pa-lokal-niva/magnetfalt/
62. Florida Administrative Code, Rule 62-814.450 (150 mG for lines ≤230 kV; 200 mG for >230–500 kV; 250 mG for >500 kV). https://www.flrules.org/gateway/ruleNo.asp?id=62-814.450 ; TRC, EMF report for the Champlain Hudson Power Express, filed with the New York State Department of Public Service, March 2010, §3.3 (New York PSC interim standard, 200 mG at the edge of the right-of-way; “no Federal standards”). https://documents.dps.ny.gov/public/Common/ViewDoc.aspx?DocRefId=%7BED95C2A2-2DEA-4FFC-A8DA-CD9C39F5D361%7D ; PG&E, Tri-Valley 2002 Capacity Increase Project PEA, Appendix F, “Electric and Magnetic Fields,” November 1999 (CPUC D.93-11-013: “no-cost and low-cost” measures, no numerical standard). https://ia.cpuc.ca.gov/environment/info/aspen/tri-valley/Appendix%20F%20-%20Electric%20and%20Magnetic%20Fields.pdf ; PG&E, Moraga–Oakland X 115 kV Rebuild PEA, Appendix 4, “EMF Discussion,” 2024 (D.06-01-042 “affirmed its existing policy of requiring no-cost and low-cost mitigation”). https://www.pge.com/assets/pge/docs/about/pge-systems/mox-ptc-application-exb-pea-appx-4-emf-information-508.pdf
63. Orville Plum (Acting Sr. Electric Division Manager, Engineering & Compliance, Silicon Valley Power), “SVP Electric Service to New Stadium,” IEEE Santa Clara Valley IAS/PES, May 15, 2013 — slide 6: “SVP had to Build a new Substation and Remove an Existing Substation to meet stadium construction schedules”; slide 7, “SVP Substations Serving the Stadium Area” (labels “NRS/Esperanca Substation,” “Mission Substation,” “Tasman Substation”); slide 8, “Tight Spacing for Stadium” (“Practice Field,” “Tasman Substation,” “SVP Substation,” “SVP Generation”); slide 9, “SVP Mission Substation & Transmission” (photo captioned “60kV Riser Poles”); slide 10, “Customer Requirements” (“maximum peak demand of 12 MW with expected demand to be closer to 7 to 8 MWs. Normal demand will be approximately 2 MW”; “two (2) 12kV circuits @ 600 amps each……Dedicated for the stadium on event days”); slide 11, “Circuit Arrangement and Design” (“Circuit Feeders will come from different Stations”; “Each Feeder will have 12 MW of capacity (600 amps @ 12kV)”; “Third circuit feeder is installed to provide SVP with operating flexibility”). https://ewh.ieee.org/r6/scv/pes_ias/2013%20Events/IEEEStadiumPresentationMay2013.pdf
64. City of Santa Clara, agenda report, “Delegation of Authority to City Manager to Approve Bid Documents, Solicit Bids, Award Public Works Contracts … associated with Mission Substation Construction,” November 7, 2011 (heard November 15, 2011): “SVP is relocating electric facilities in proximity to the new Football Stadium site including electric substructures, distribution lines, fiber optic lines, transmission lines, and the removal of Tasman Substation”; work list includes “Mission Substation 60kV Underground Transmission Line Construction (CIP 2114),” “Relocation and Installation of Underground Substructures and Electric and Fiber Optic Cable (CIP 2005),” and “Transmission Steel Poles (CIP 2401 and CIP 2005).” https://www.santaclaraca.gov/home/showpublisheddocument/6386/635713044859030000 ; archived: http://web.archive.org/web/20200512191712/https://www.santaclaraca.gov/home/showdocument?id=6386 . Companion: agenda report, “Approval of the Project Manual for Lump Sum Bidding and Construction of Mission Substation (Public Works Contract 2114A),” October 6, 2011 (Council, October 25, 2011) — “Two thirds of the construction cost will be funded by CIP Project 2114 and one third of the cost will be funded by CIP Project 2401.” https://www.santaclaraca.gov/home/showpublisheddocument/13050/635713044859030000
65. City of Santa Clara dba Silicon Valley Power, Form 4, “Demand Forecast Models and Methods,” CEC Docket 23-IEPR-02, TN 250929-1, July 3, 2023 — “SVP Distribution Engineers take a snapshot of SVP’s system load for the average of the 5-minute intervals over the annual peak hour of SVP’s system by substation down to the transformer bank level via our SCADA system”; “SVP’s transmission planning engineers layer 60kV load ramps onto the BaseCase Switch Plan.” https://efiling.energy.ca.gov/GetDocument.aspx?tn=250929-1
66. Silicon Valley Power, comment letter to the CAISO Board of Governors, March 15, 2022 (Attachment A, comments on the Draft 2021–2022 Transmission Plan, February 22, 2022): “two additional 230/115kV transformers have been planned (rated 600MVA) at the NRS substation.” https://www.caiso.com/Documents/PublicCommentLetter-SiliconValleyPower-2021-2022-TransmissionPlan-Mar15-2022.pdf
67. Paul Ciampoli, American Public Power Association, “Silicon Valley Power Takes Delivery of New 336 MVA Power Transformer,” July 31, 2026 (“seven 336 MVA, 115/60 kV power transformers to support major upgrades at our Northern, Kifer, and Scott Receiving Stations”). https://www.publicpower.org/periodical/article/silicon-valley-power-takes-delivery-new-336-mva-power-transformer ; City of Santa Clara, award of Contract 2454 (NRS Upgrades and Expansion) to Henkels & McCoy West, File 25-417, July 8, 2025 (“three 115kV/60kV, 336MVA and two 230kV/115kV, 560MVA power transformers”). https://santaclara.legistar.com/LegislationDetail.aspx?ID=7455917&GUID=BFCA1DB6-674A-46E6-8CFF-0BC1D8A7652A&FullText=1 ; David Alexander, Silicon Valley Voice, “City Approves SVP Upgrades, Eminent Domain On Another Property,” July 15, 2025. https://www.svvoice.com/city-approves-svp-upgrades-eminent-domain-on-another-property/ . Amps derived: I = S / (√3 × V).
68. Silicon Valley Power, System Expansion Plan Updates (Growth Plan Project Updates webinar series), April 30, 2024 through July 7, 2026. NRS slide, April 30 and June 25, 2024: “Replace two NRS 115/60kV Transformers (372 to 672 MVA)”; “NRS 115/60kV Transformer Spare (3rd Transformer)”; “Two new NRS 230KV Transformers (560 MVA), existing (420MVA) to remain in parallel.” Northwest Loop Capacity Upgrade slide, energization target: December 2025 (June 25 and Aug 27, 2024); Q1 2026 (Oct 29, 2024 – June 24, 2025); Q2 2026, “Issue for Bid set on hold pending outage analysis” (Nov 4, 2025; Jan 13, 2026); Q1 2027 (Apr 28 and July 7, 2026; July 7: “Delays due to available outage dates, material procurement, Valley Water encroachment permit, unforeseen conditions, etc. may impact date”). Decks: June 25, 2024 https://www.siliconvalleypower.com/home/showpublisheddocument/84346/638556095898800000 ; Aug 27, 2024 https://www.siliconvalleypower.com/home/showpublisheddocument/85280/638652064039830000 ; Oct 29, 2024 https://www.siliconvalleypower.com/home/showpublisheddocument/85406/638664183235470000 ; Nov 4, 2025 https://www.siliconvalleypower.com/home/showpublisheddocument/88435/638981190210300000 ; Jan 13, 2026 https://www.siliconvalleypower.com/home/showpublisheddocument/88791/639040874121770000 ; Apr 28, 2026 https://www.siliconvalleypower.com/home/showpublisheddocument/90403/639204178994100000 ; July 7, 2026 https://www.siliconvalleypower.com/home/showpublisheddocument/90401/639204158421370000 ; April 30, 2024 https://www.siliconvalleypower.com/home/showpublisheddocument/84344/638556095893470000 ; all decks: https://www.siliconvalleypower.com/svp-and-community/projects (Past Presentations).
69. 3M, “3M Aluminum Conductor Composite Reinforced (ACCR) Technical Summary,” metric units, issued July 2009, ampacity table (IEEE Std. 738-1993; 40°C air, 0.6 m/s wind): ACCR_637-T16, 1,453 A; ACCR_824-T16, 1,692 A at 210°C. https://powerenergy.com.pl/wp-content/uploads/2017/01/ACCR_specs2.pdf ; 3M, ACCR Technical Summary, English units, 2014. https://multimedia.3m.com/mws/media/478270O/3m-tm-accr-technical-summary-english-units.pdf
71. California Public Utilities Commission, Proposed Decision of ALJ Thomas on Application 99-09-029, PG&E Northeast San Jose Transmission Reinforcement Project (mailed April 2, 2001; agenda May 3, 2001), §III.E.2(b): the Northern Receiving Station alternative “would be co-located with a 115 kV substation approved (but not yet built) by the City of Santa Clara.” https://docs.cpuc.ca.gov/word_pdf/COMMENT_DECISION/6240.doc ; CPUC Final EIR for the same project, February 2001, Section A, p. A-4: the site “has been approved by the City for use as a 115kV substation.” https://ia.cpuc.ca.gov/environment/info/aspen/nesanjo/Section%20A_Intro.pdf ; CPUC Draft EIR, June 2000, §B.6.2.1, p. B-66 (“construction of the 115kV substation has not started”). https://ia.cpuc.ca.gov/Environment/Info/aspen/nesanjo/secBpartII.pdf ; CEQAnet SCH 2003092044, City of Santa Clara, “Northern Receiving Station Transmission Reinforcement Project,” Negative Declaration, September 12, 2003: “Construction of additional facilities in existing electric receiving station.” https://ceqanet.lci.ca.gov/2003092044 ; CPUC D.99-08-023, August 5, 1999 (Kifer “existing”; no Northern Receiving Station). https://files.cpuc.ca.gov/LegacyCPUCDecisionsAndResolutions/Decisions/Decisions_D9901001_to_D0006092/D9908023_19990805_A9806001.pdf
Amazing work.
I would think the 49ers (players, managers and owners) really appreciate your work! I can see why there is an effort to keep the suppressed.